Kaiser Permanente
End-to-end service design connecting Kaiser Permanente with patients.
Kaiser Permanente is one of the largest health insurers in the industry and the inventor of the modern HMO, serving a large member base in California and eight other states.
As part of a new Healthy Profiles initiative, Kaiser set out to rethink key customer experiences, from onboarding to maintenance, alongside marketing tools, service design, and digital flows. These touchpoints shape the moments that matter most to members and corporate sponsors, and they drive retention.
Role & timeline
- Role
- Service design strategy lead
- Timeline
- Aug 2022 – Jan 2023
- Responsibilities
- Client communication, team leadership, journey mapping, creative direction, prototyping, user testing, and design delivery
- Key skills
- Creative strategy, research, UX, service design, visual design
Problem
Conversion across member journeys was suffering inside a very large organization with many connected systems, products, and business units.
Goal
Combine business signals, performance metrics, and user insight into one experience strategy that measurably improves conversion.
Results
Reported & estimated outcomes
- Prospect leads
- 6.2K
- Reported improvement in engagement
- 19%
- Reported increase in at-risk retention
- 1.83x
- New opportunities attributed by the client
- 2K
Prospect leads
Reported improvement in engagement
Reported increase in at-risk retention
New opportunities attributed by the client
Client estimates placed potential first-year revenue impact in the tens of millions.
01
Overview
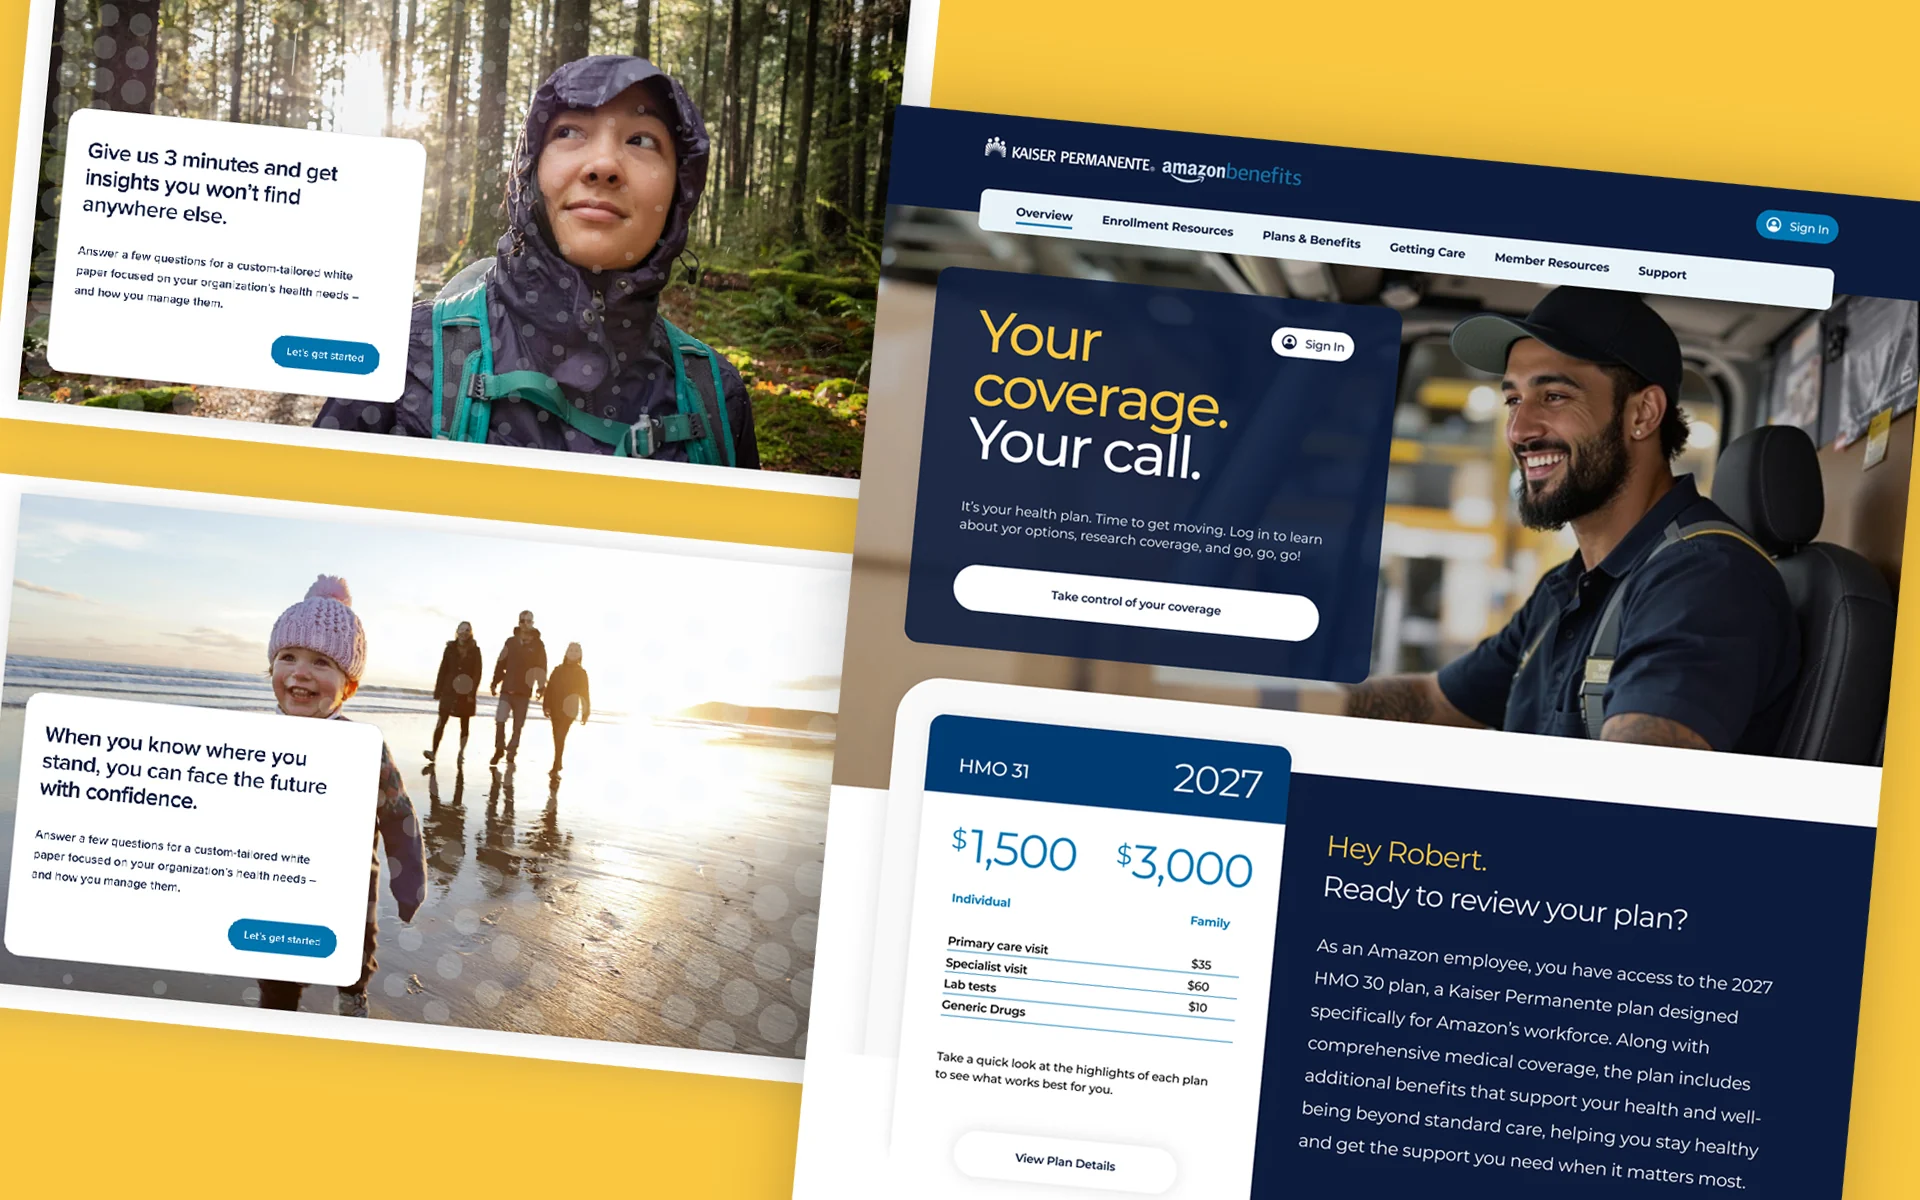
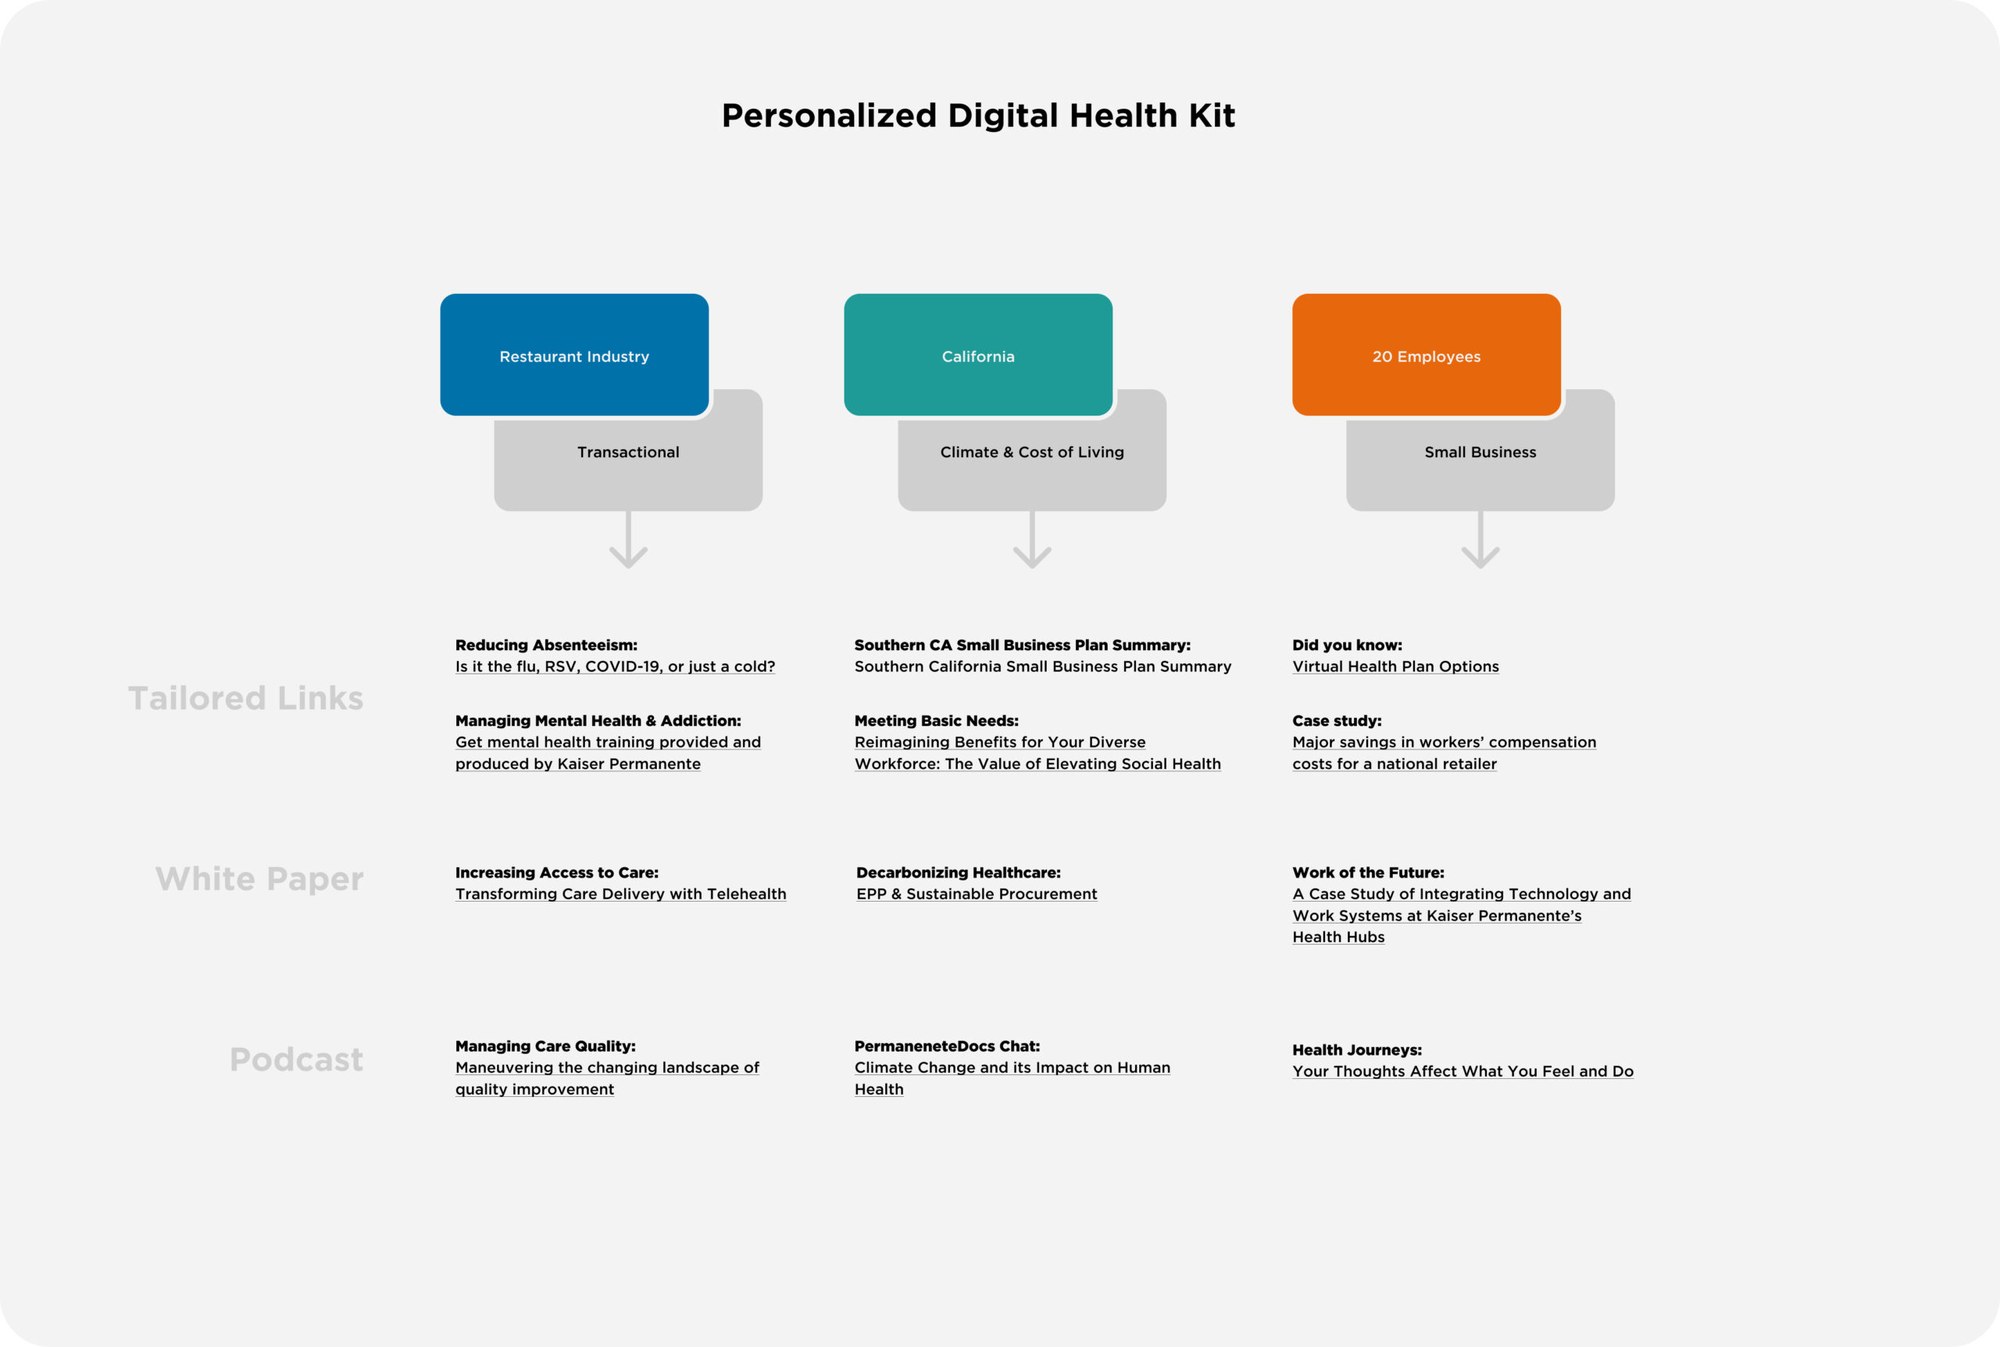
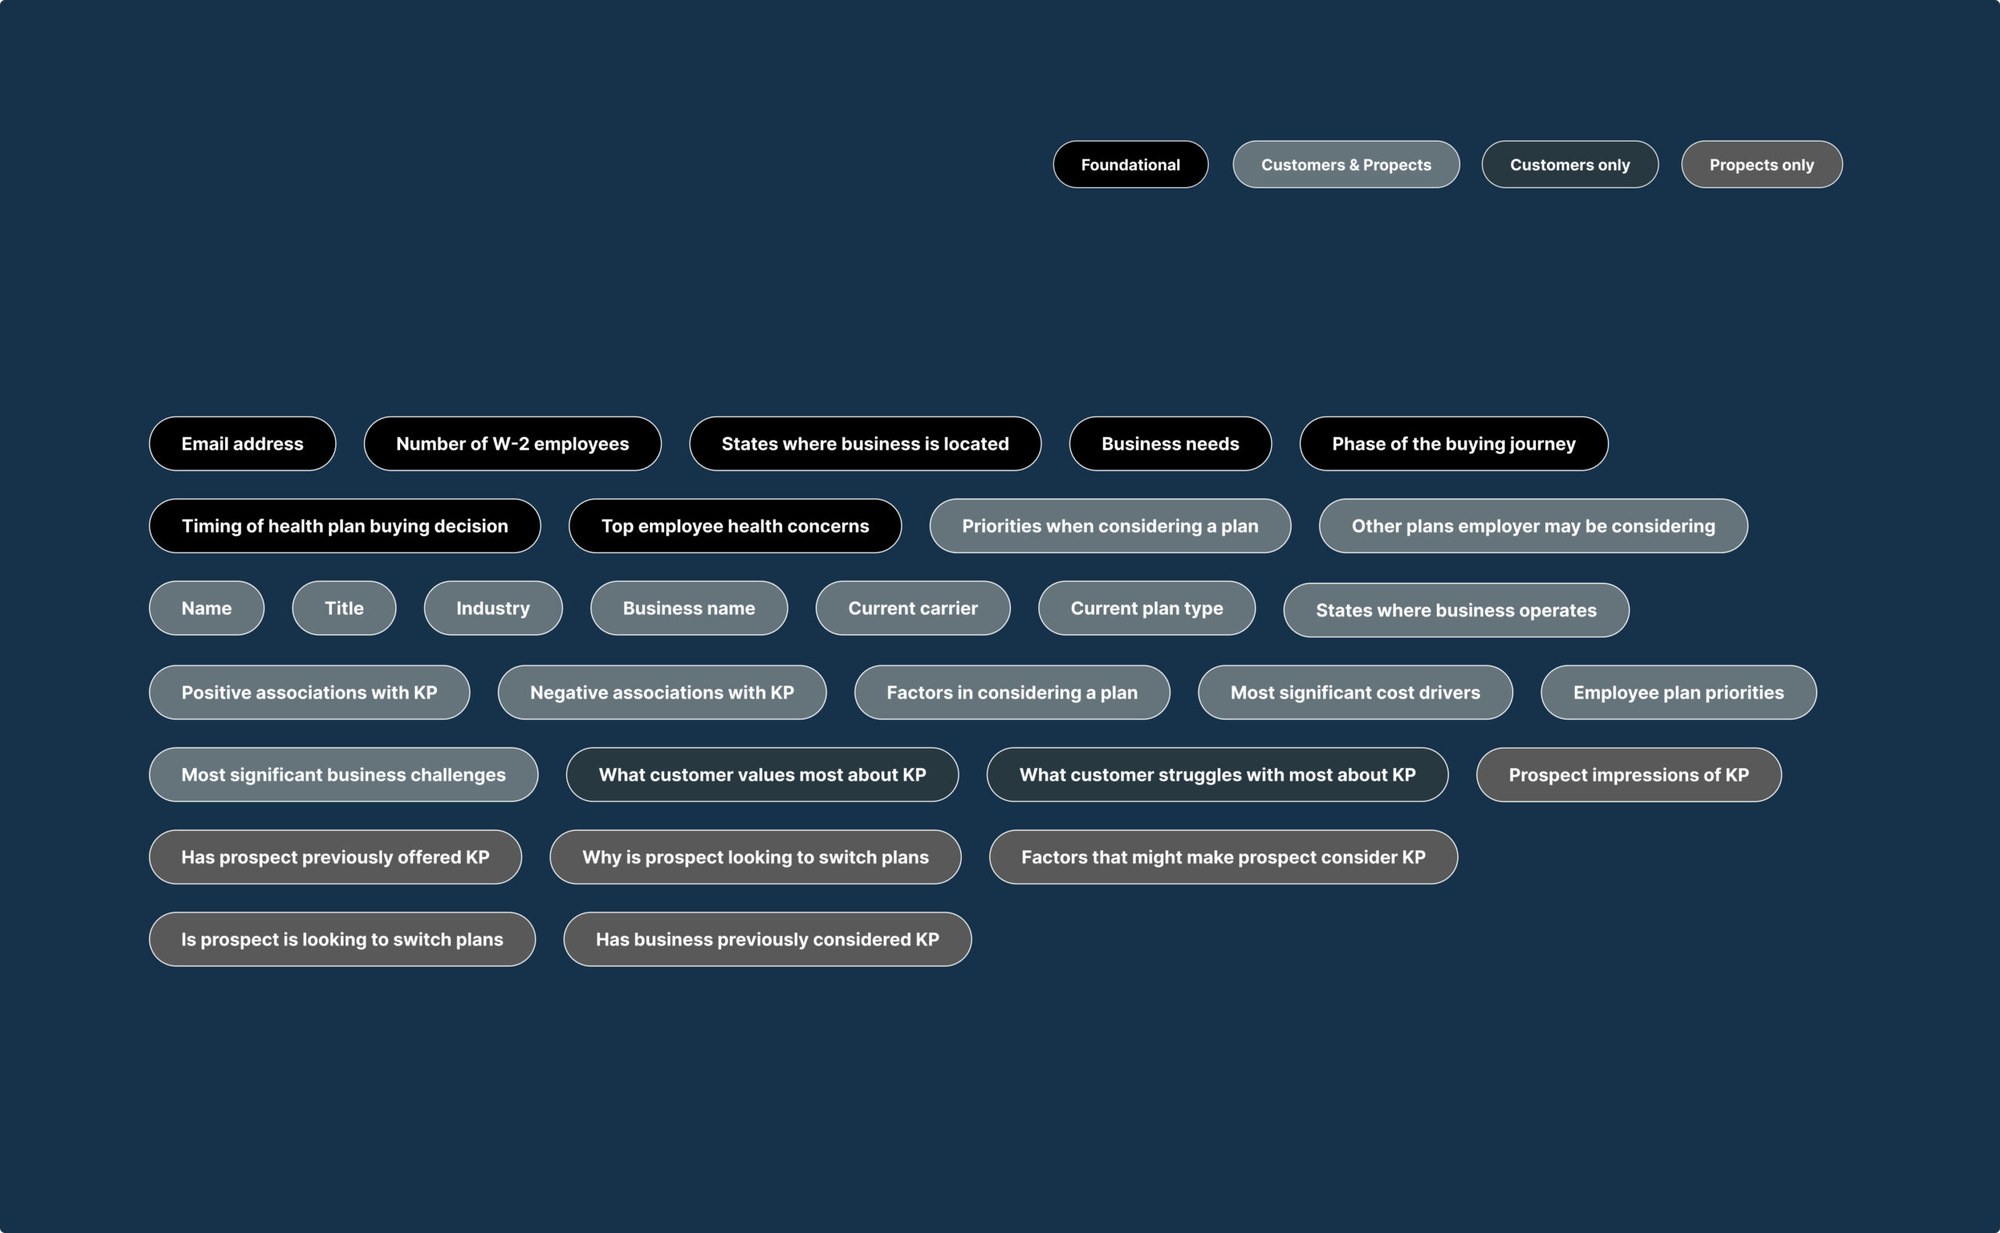
One early effort used gamification to encourage customers and prospects to finish an online self-assessment, with data capture at the end. The assessment returned personalized content based on industry and company details, giving users a profile score, benchmark data, and curated resources. It could have been just another form; instead people got something back for filling it out.
The pilot did well enough to justify a wider push across plan rollout, enrollment, and renewal, putting relevant information in front of employers and members right when they were deciding something.
02
Research & analysis
Given the scale, the challenge was not fixing individual touchpoints. It was building one clear strategy from a wide range of business signals, performance metrics, and operational constraints.
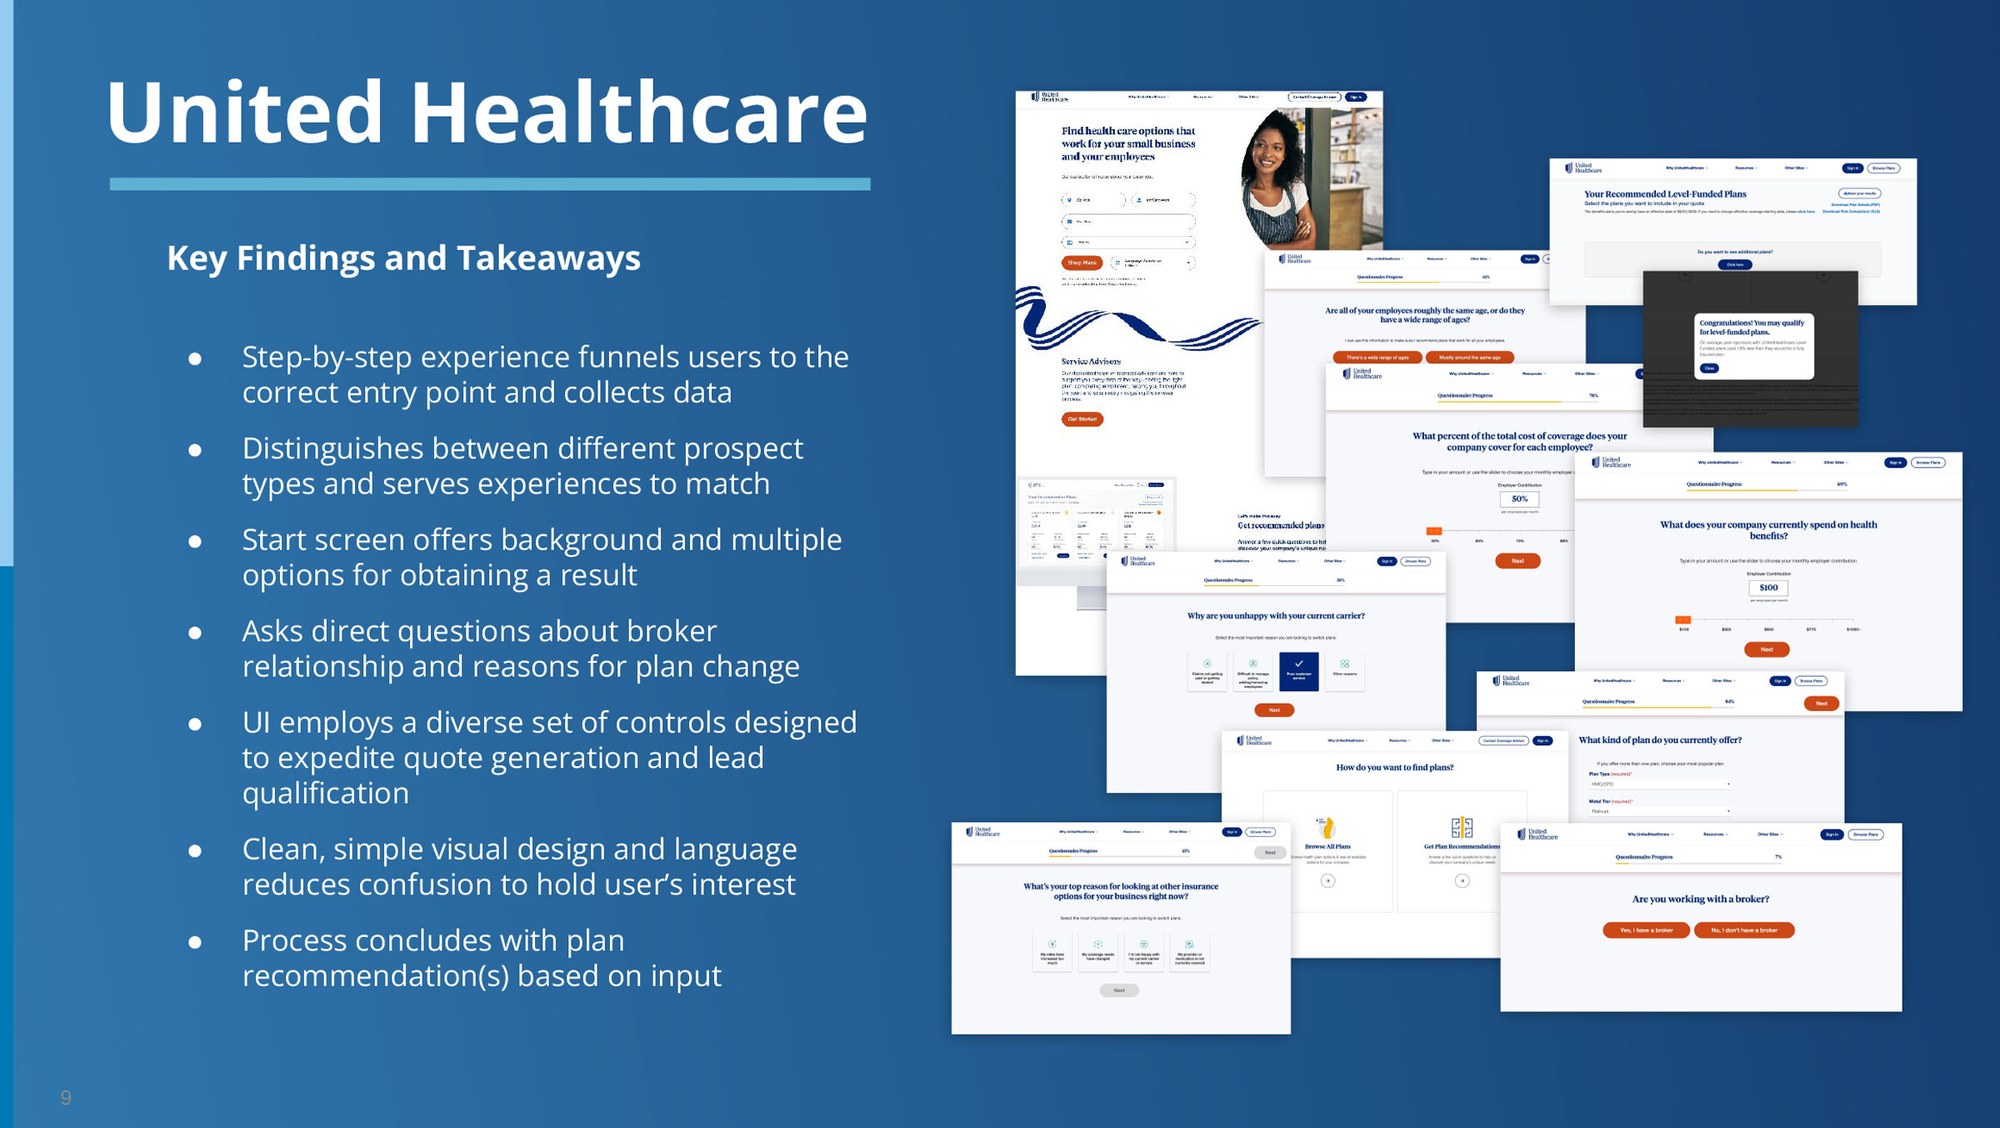
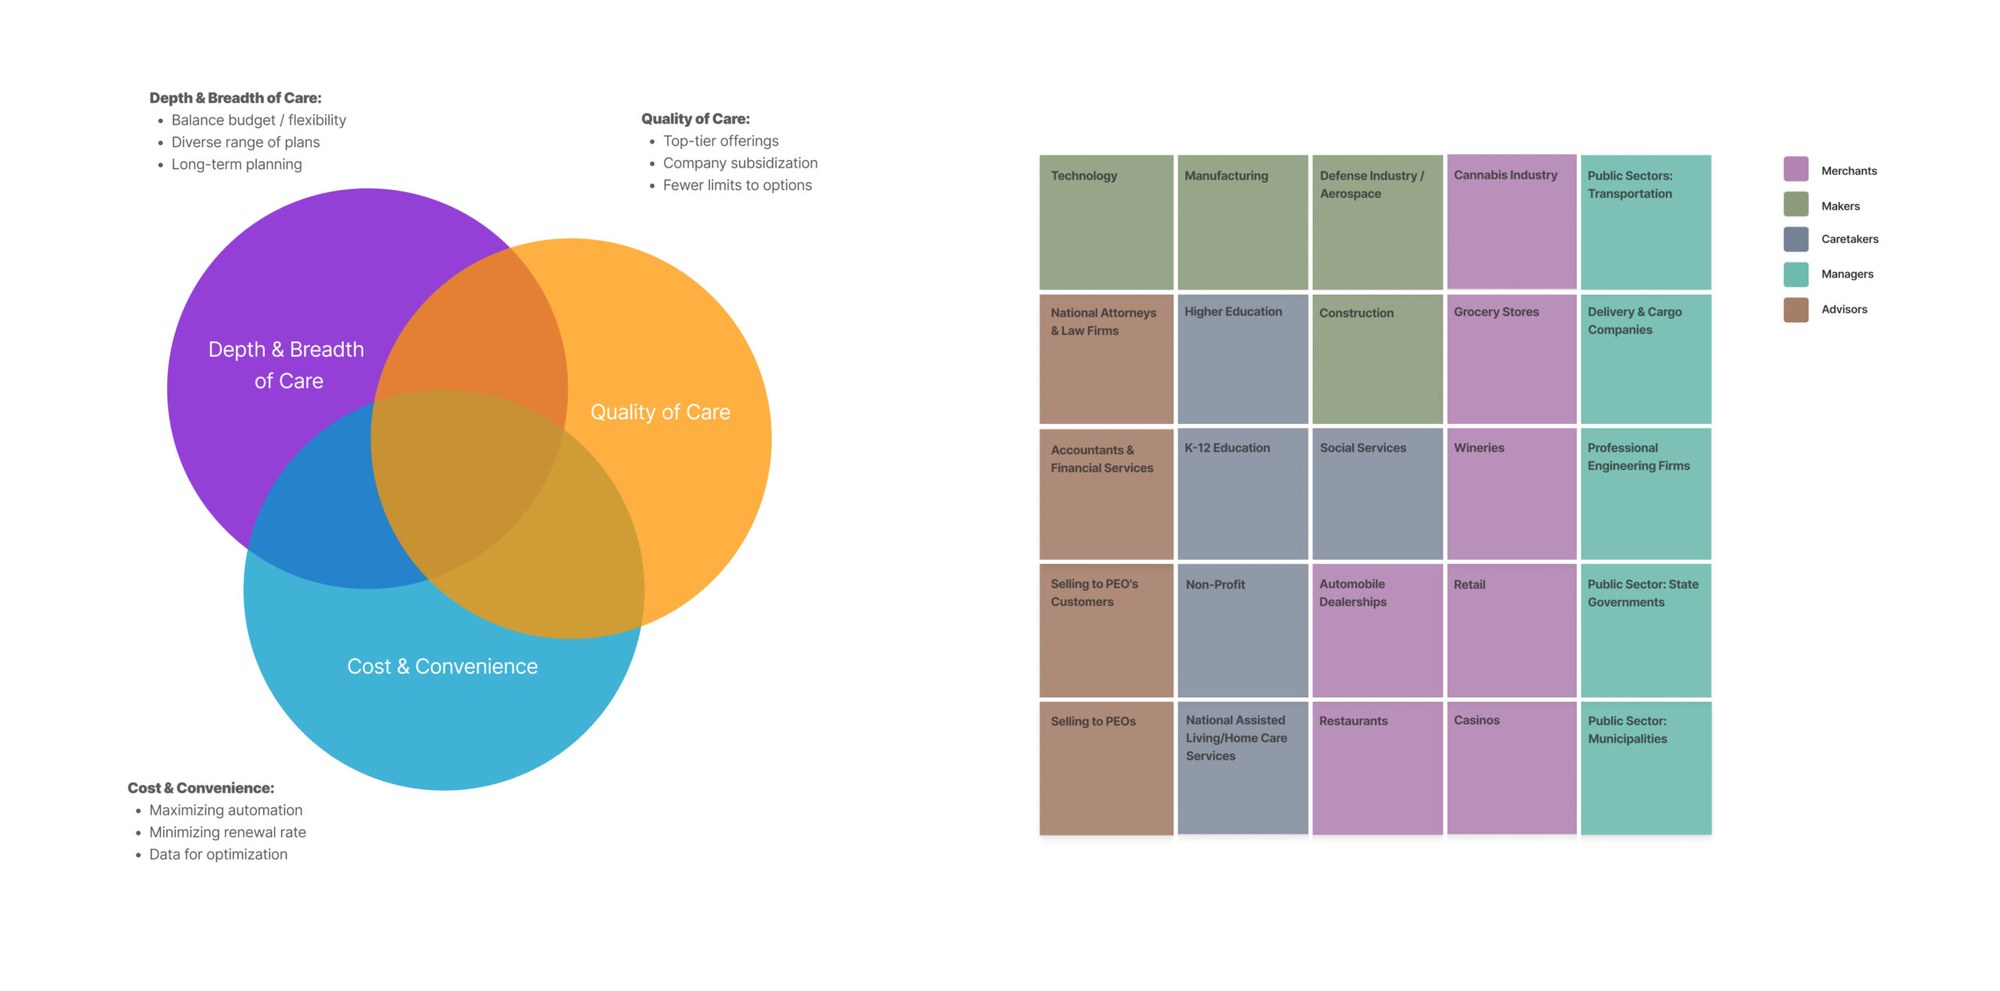
The team reviewed existing experiences, user feedback, and system limits alongside business data and KPIs from across the organization: enrollment completion rates, drop-off points, engagement metrics, and operational performance indicators. Together, those inputs showed where friction was costing conversion and where fixes would matter most.
03
Service blueprint
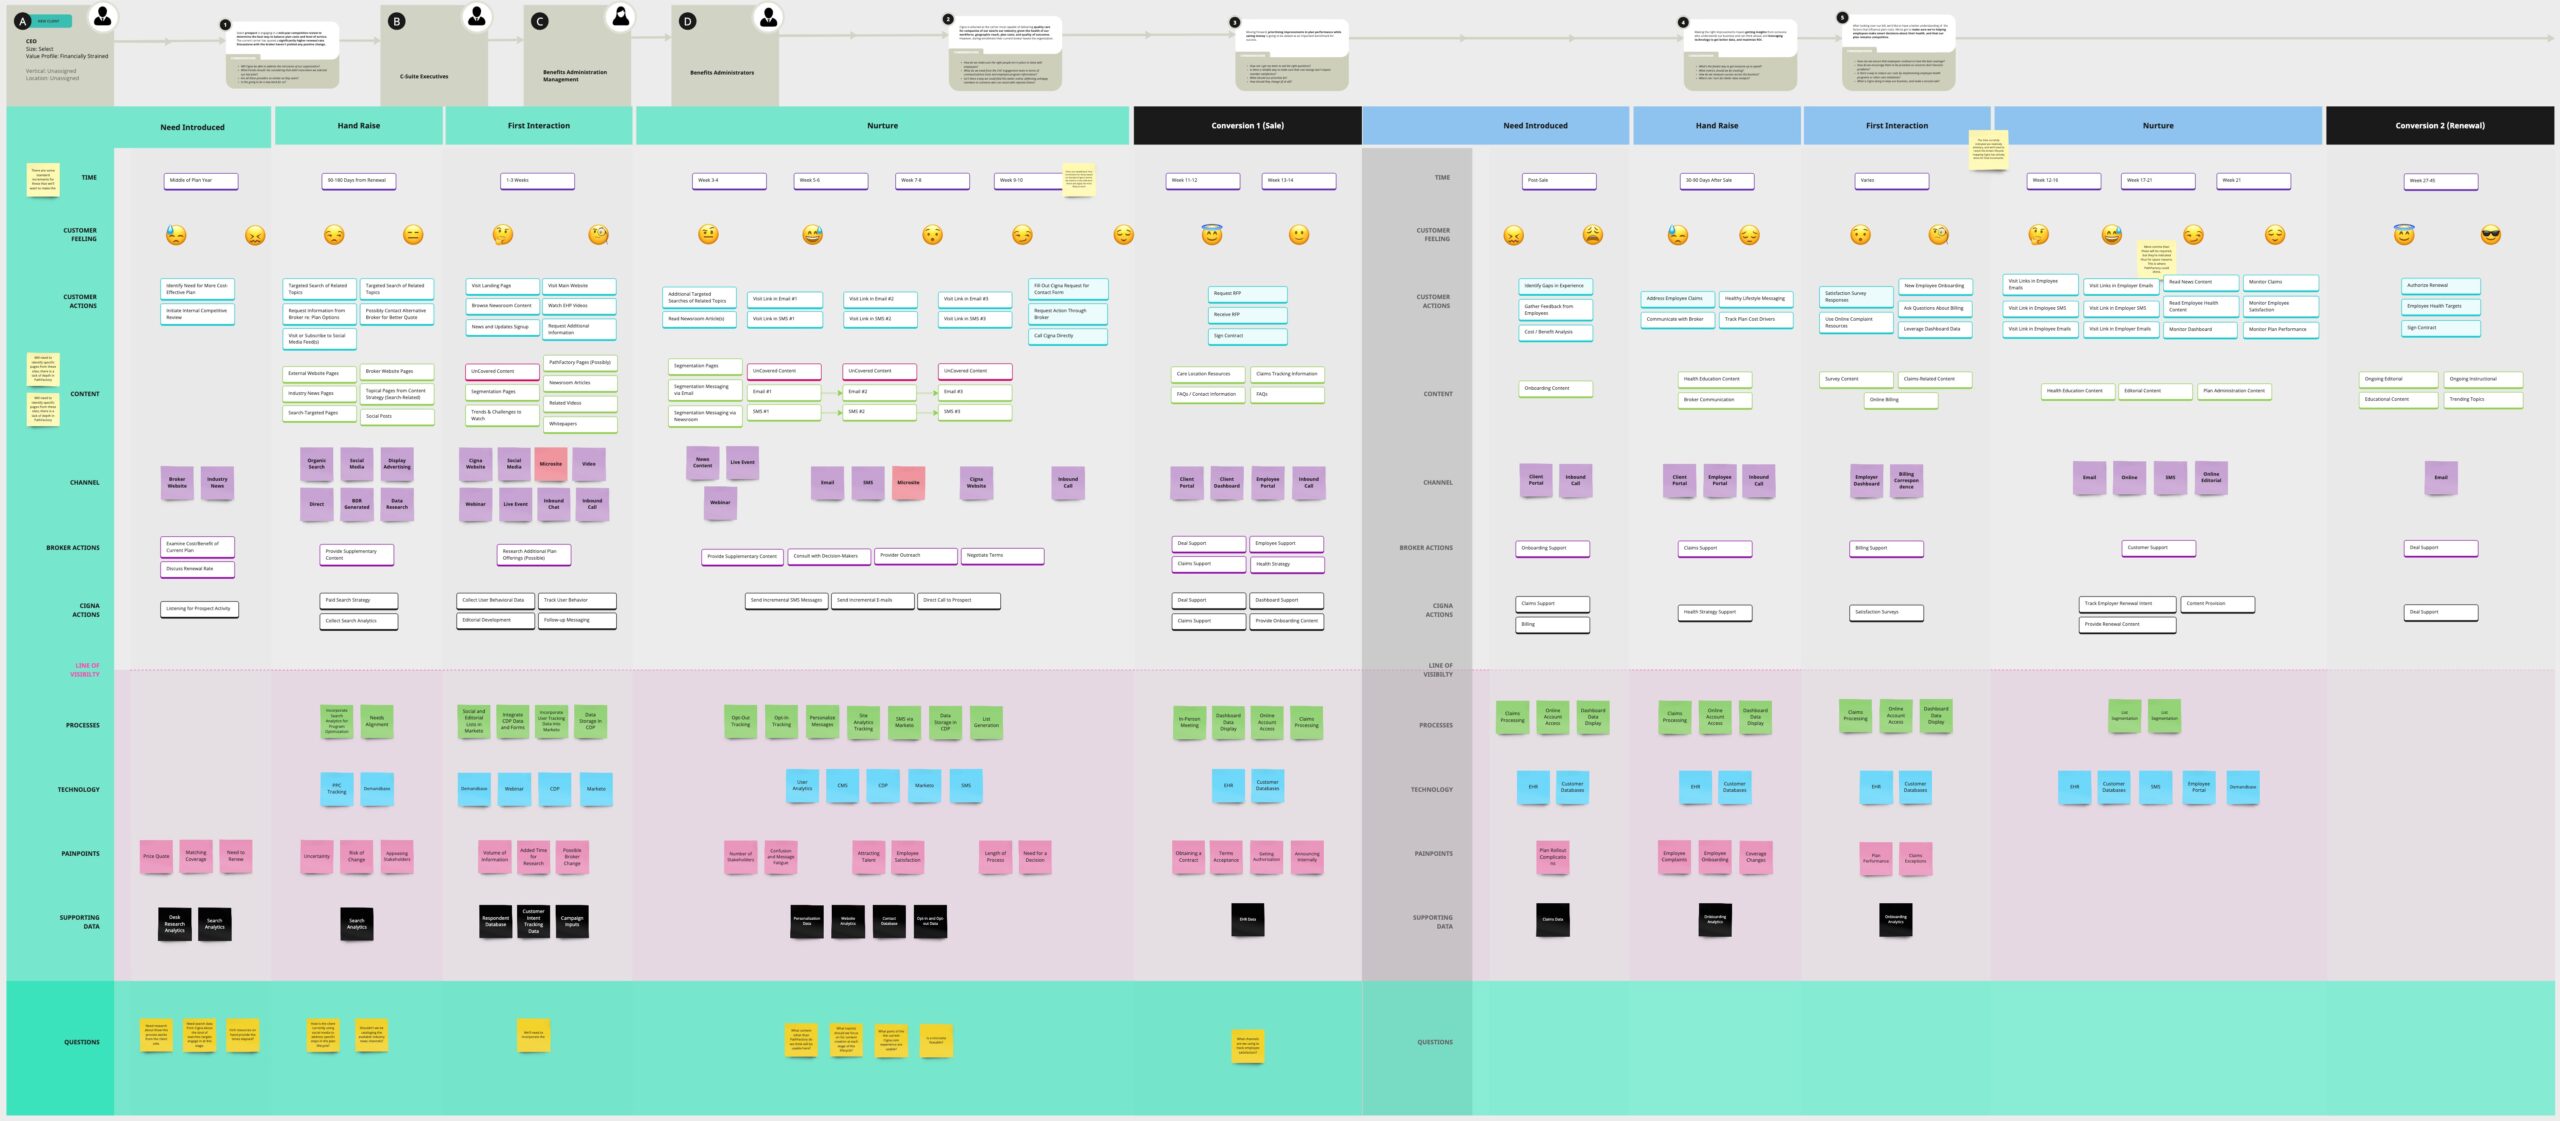
We mapped end-to-end member journeys and built a service blueprint connecting frontstage interactions to backstage processes. That exposed the gaps between what users expected and what the systems could do, along with inconsistencies across products that were costing conversion.
I led the blueprint's development, turning complex organizational inputs into a framework that tied user journeys to underlying systems and KPIs, so teams could see how design decisions would affect measurable outcomes.
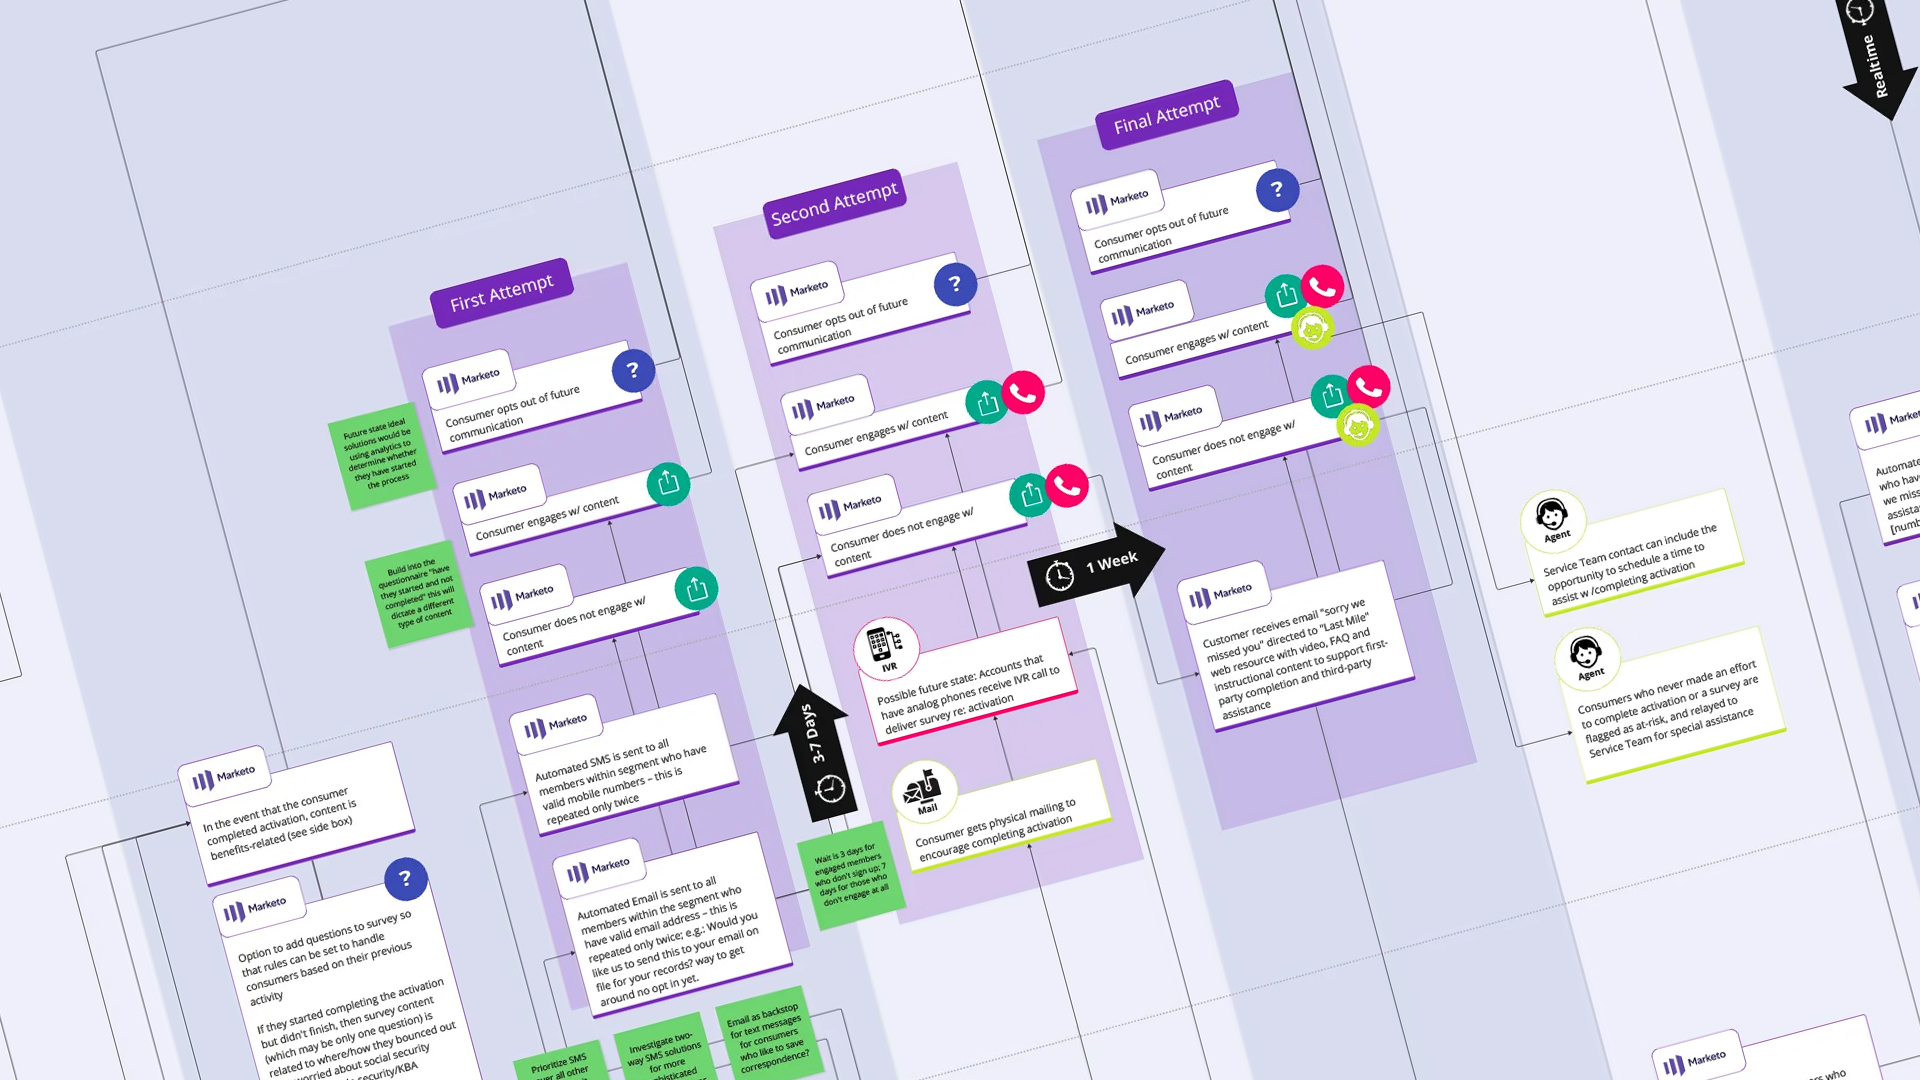
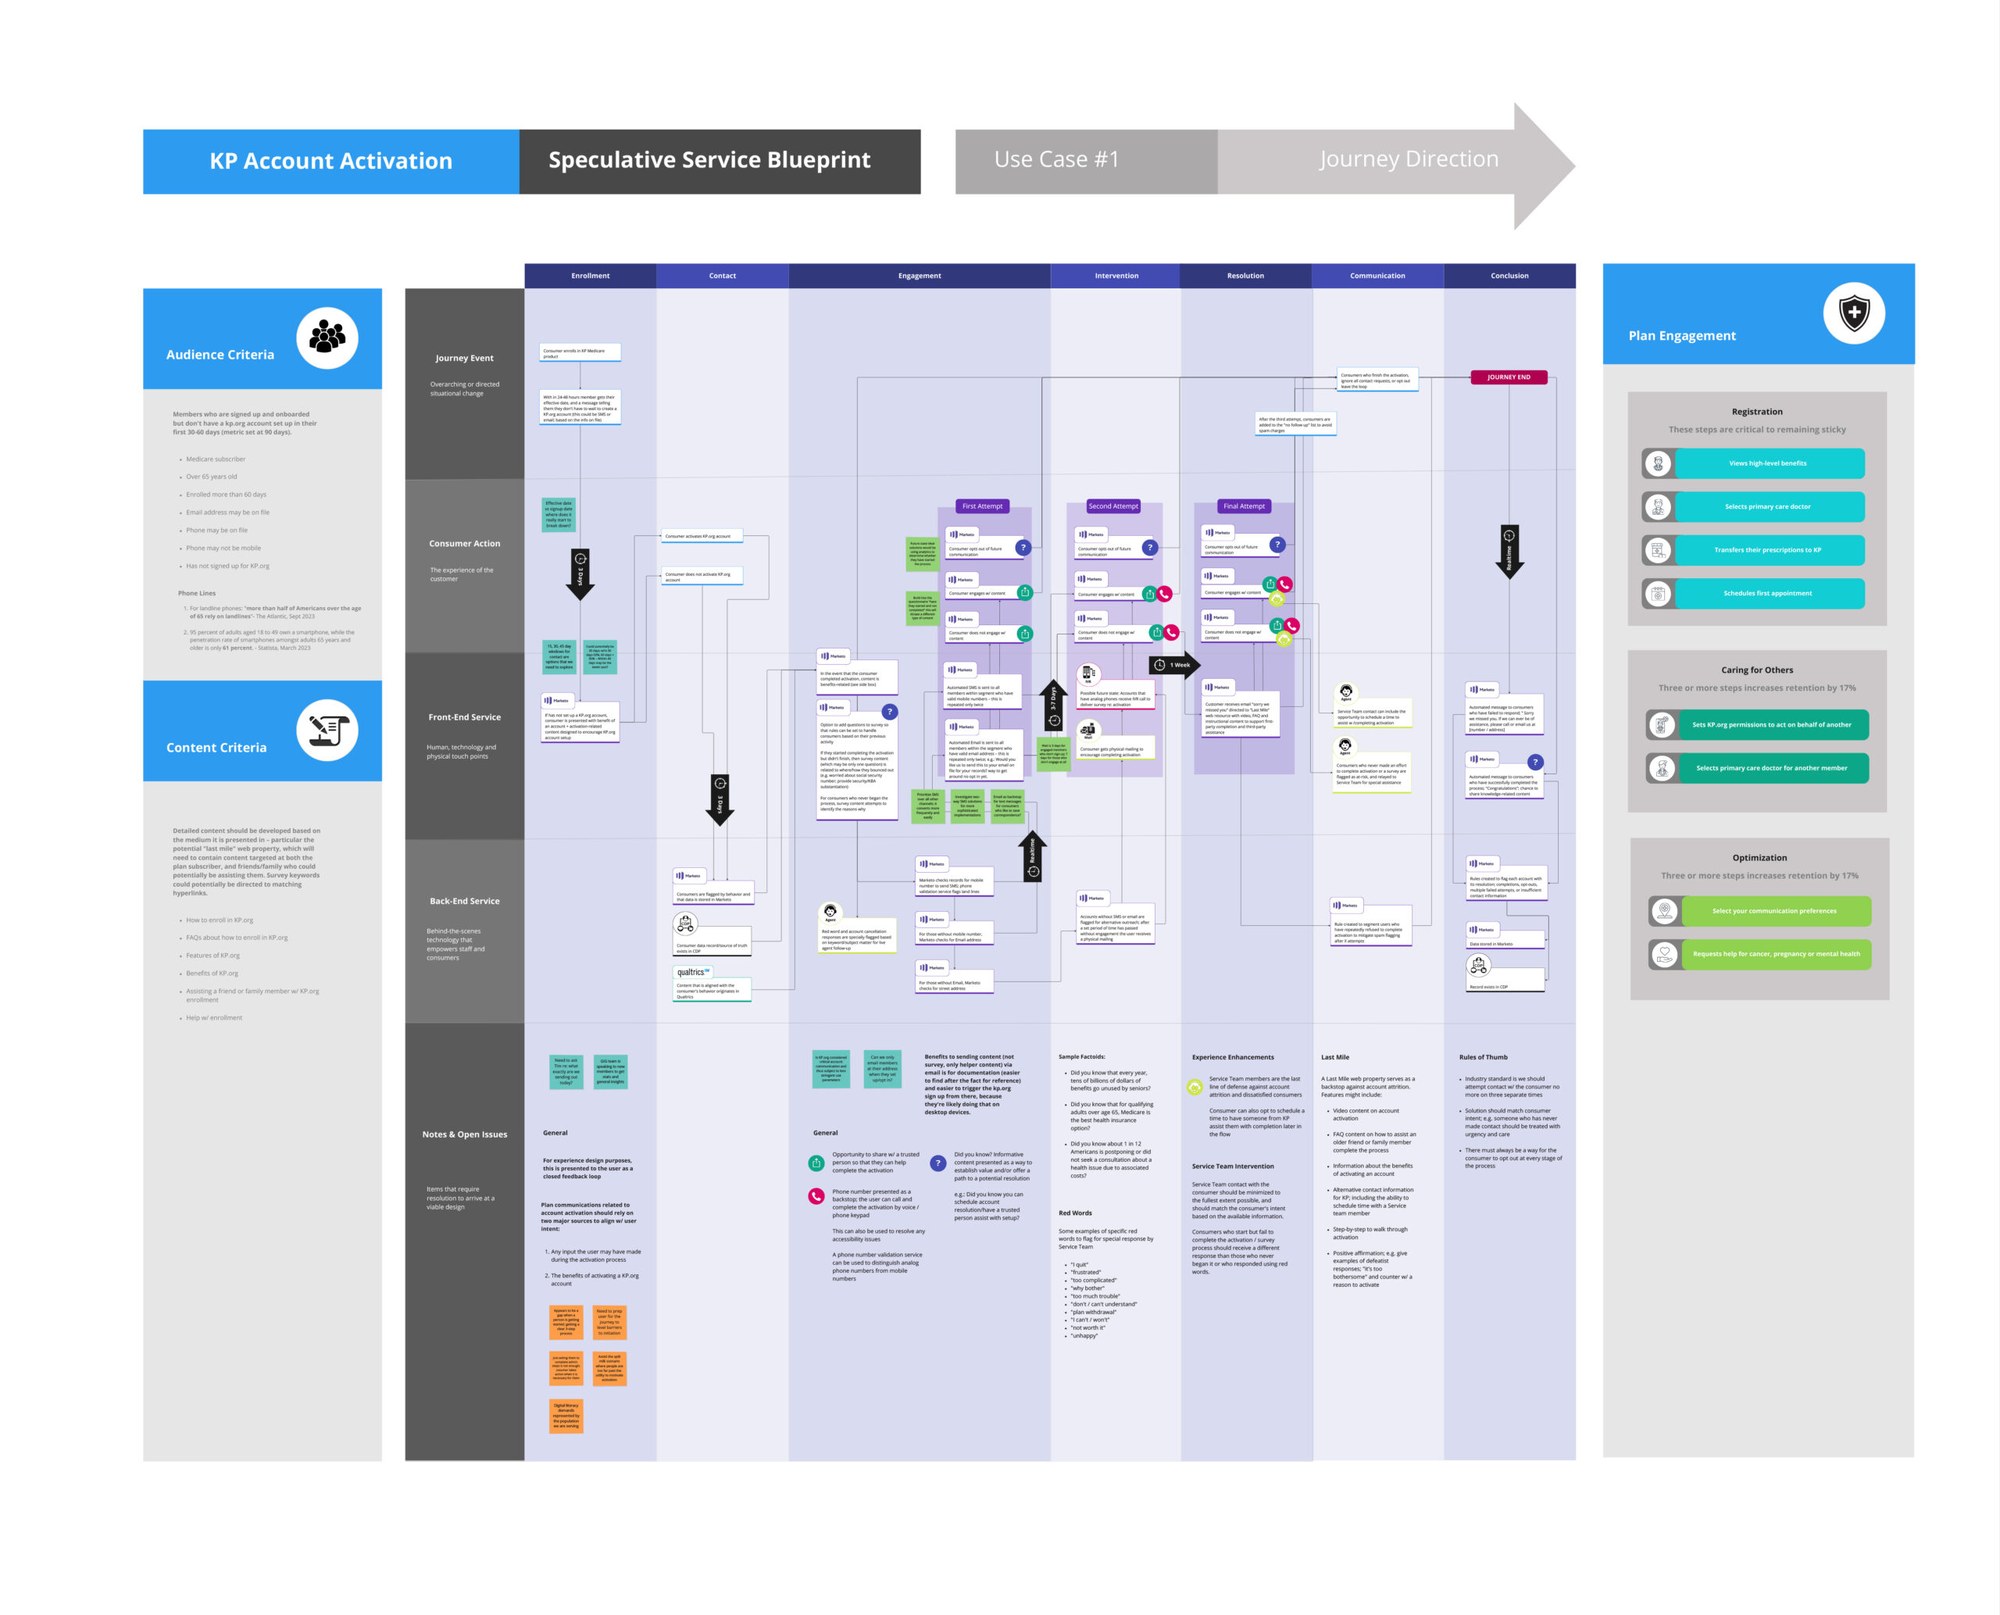
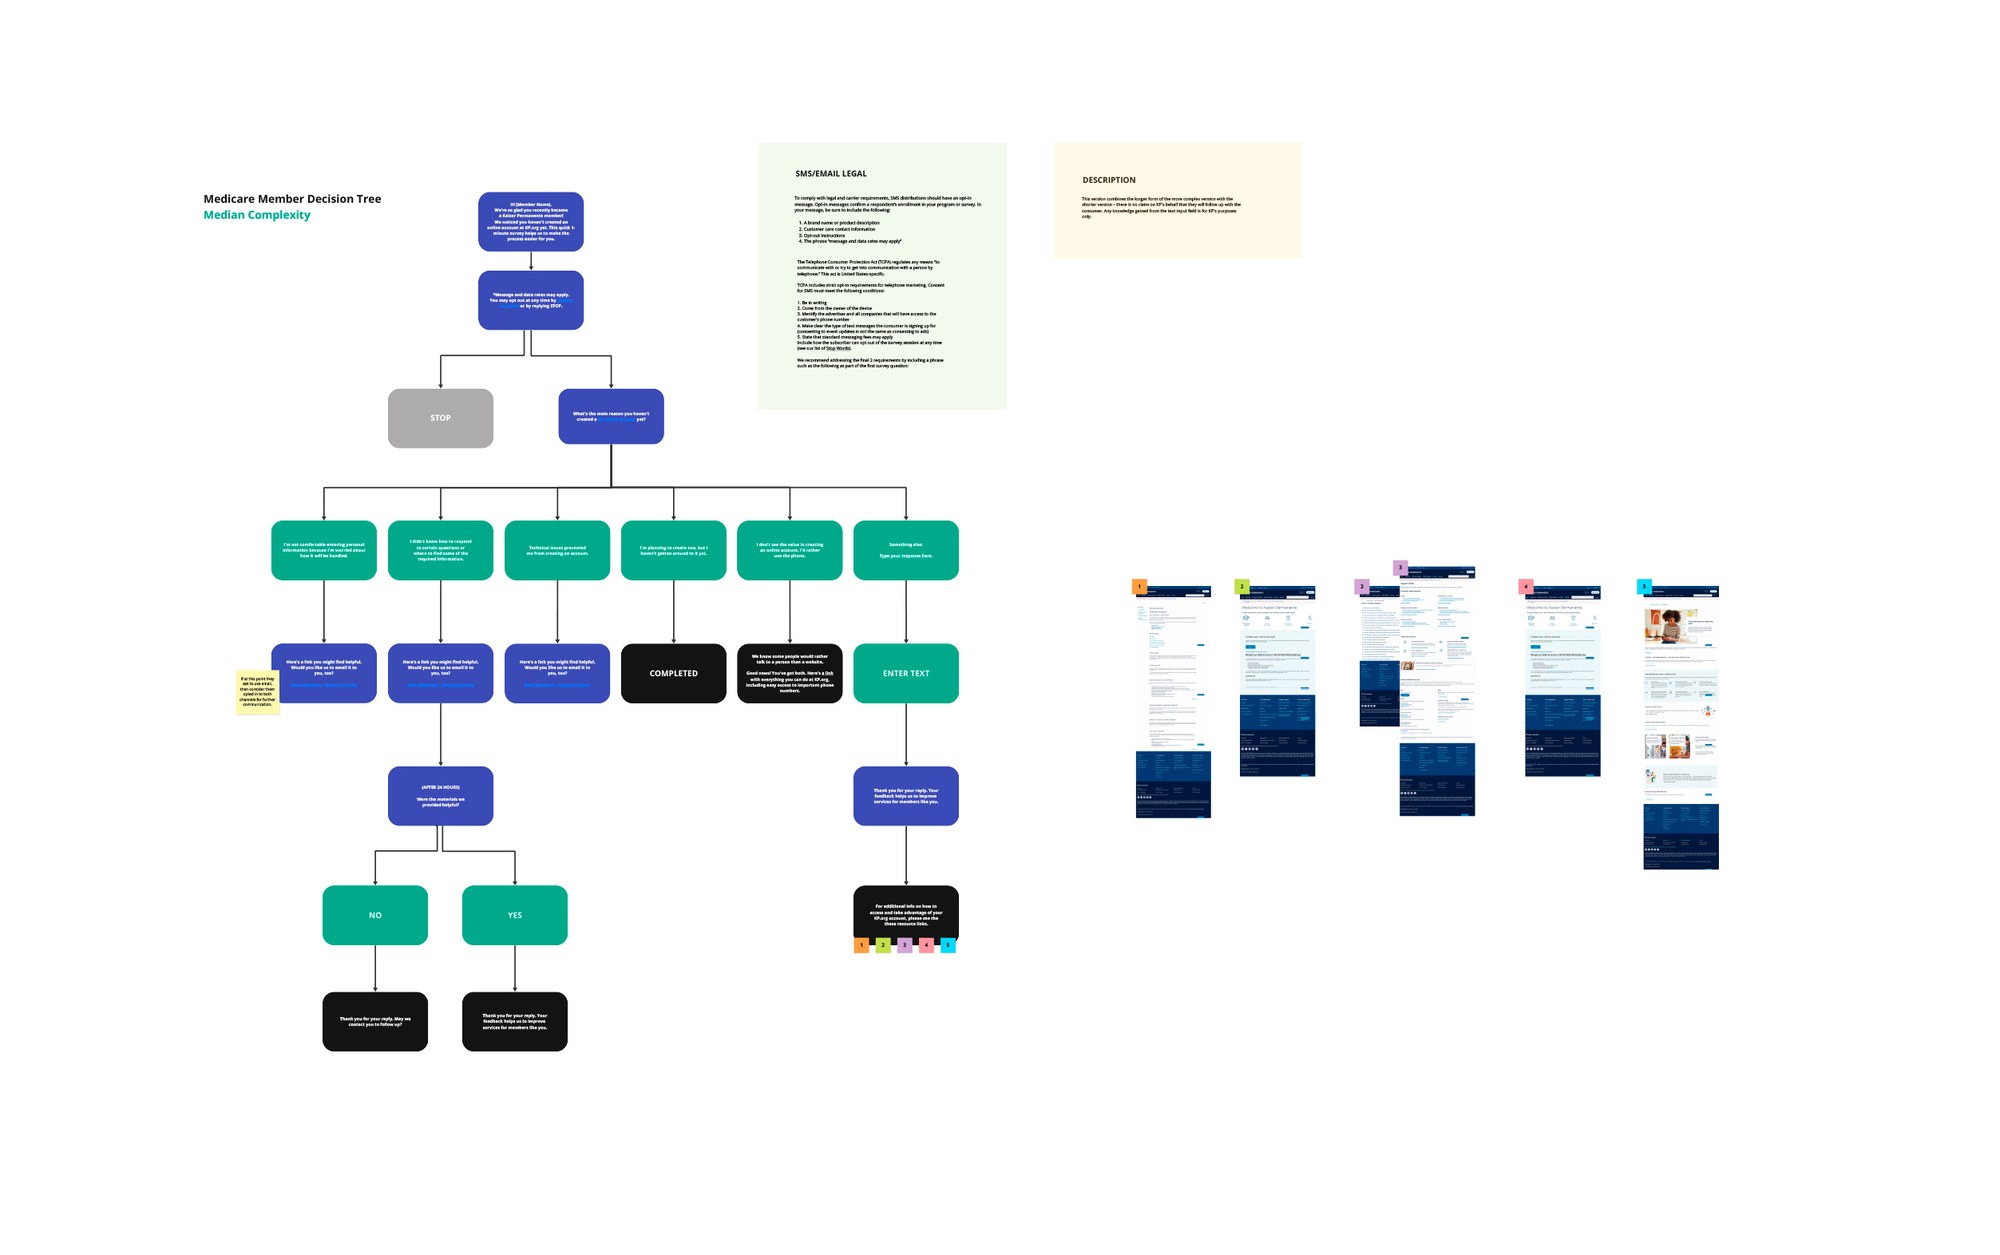
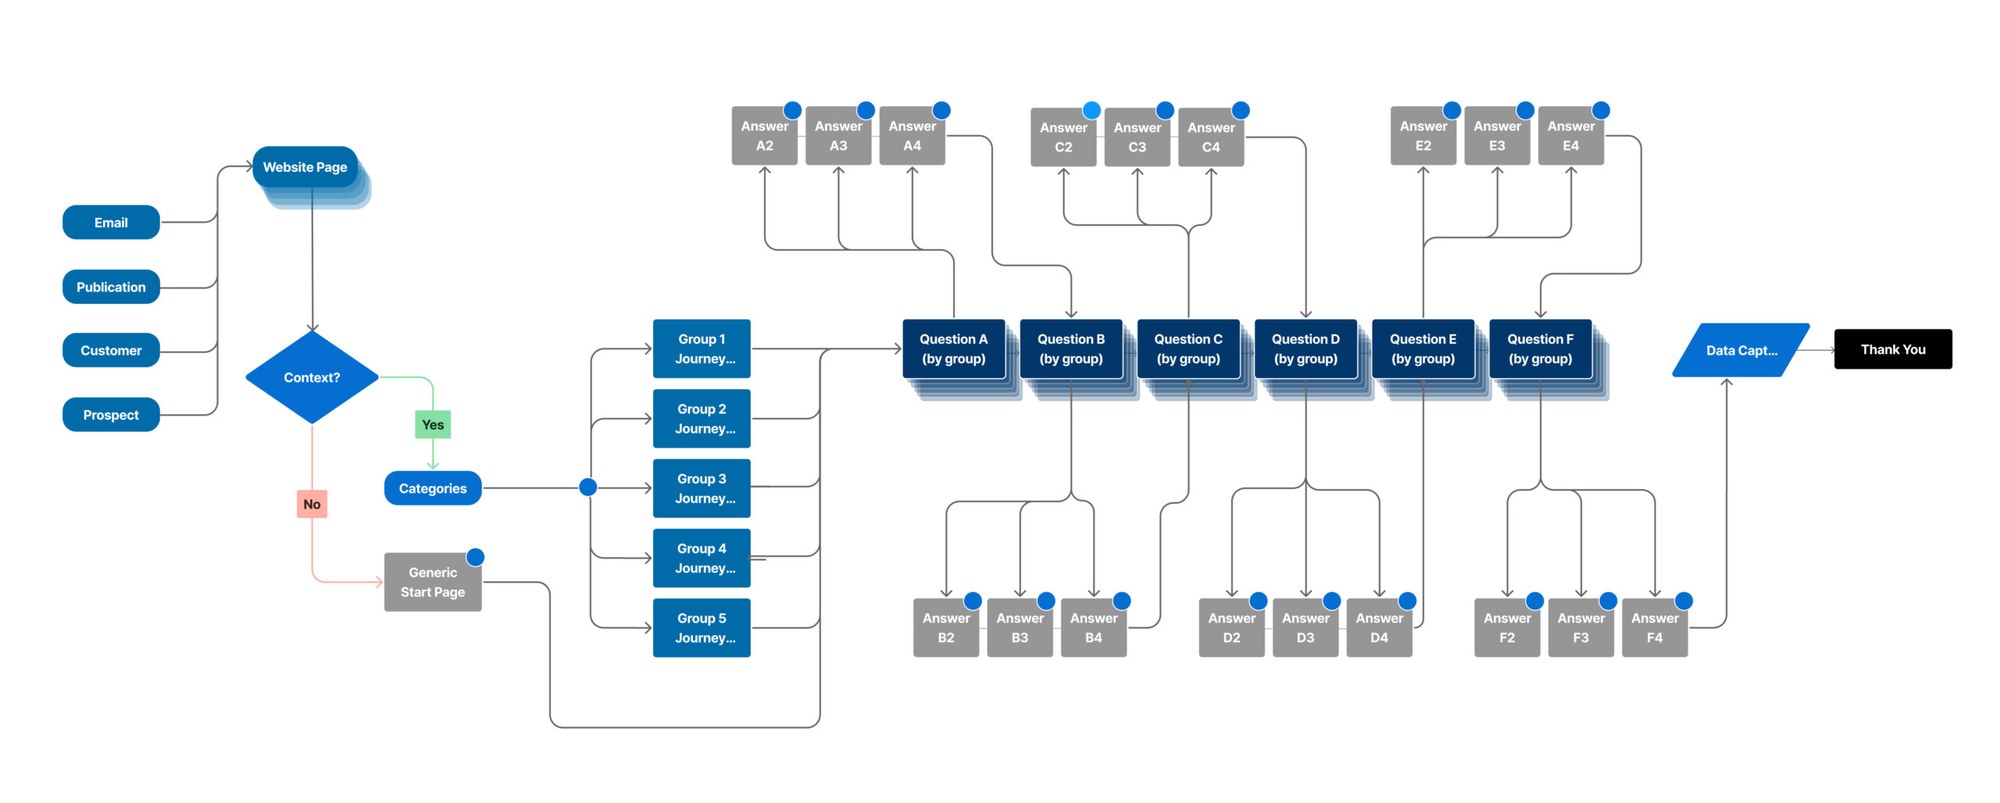
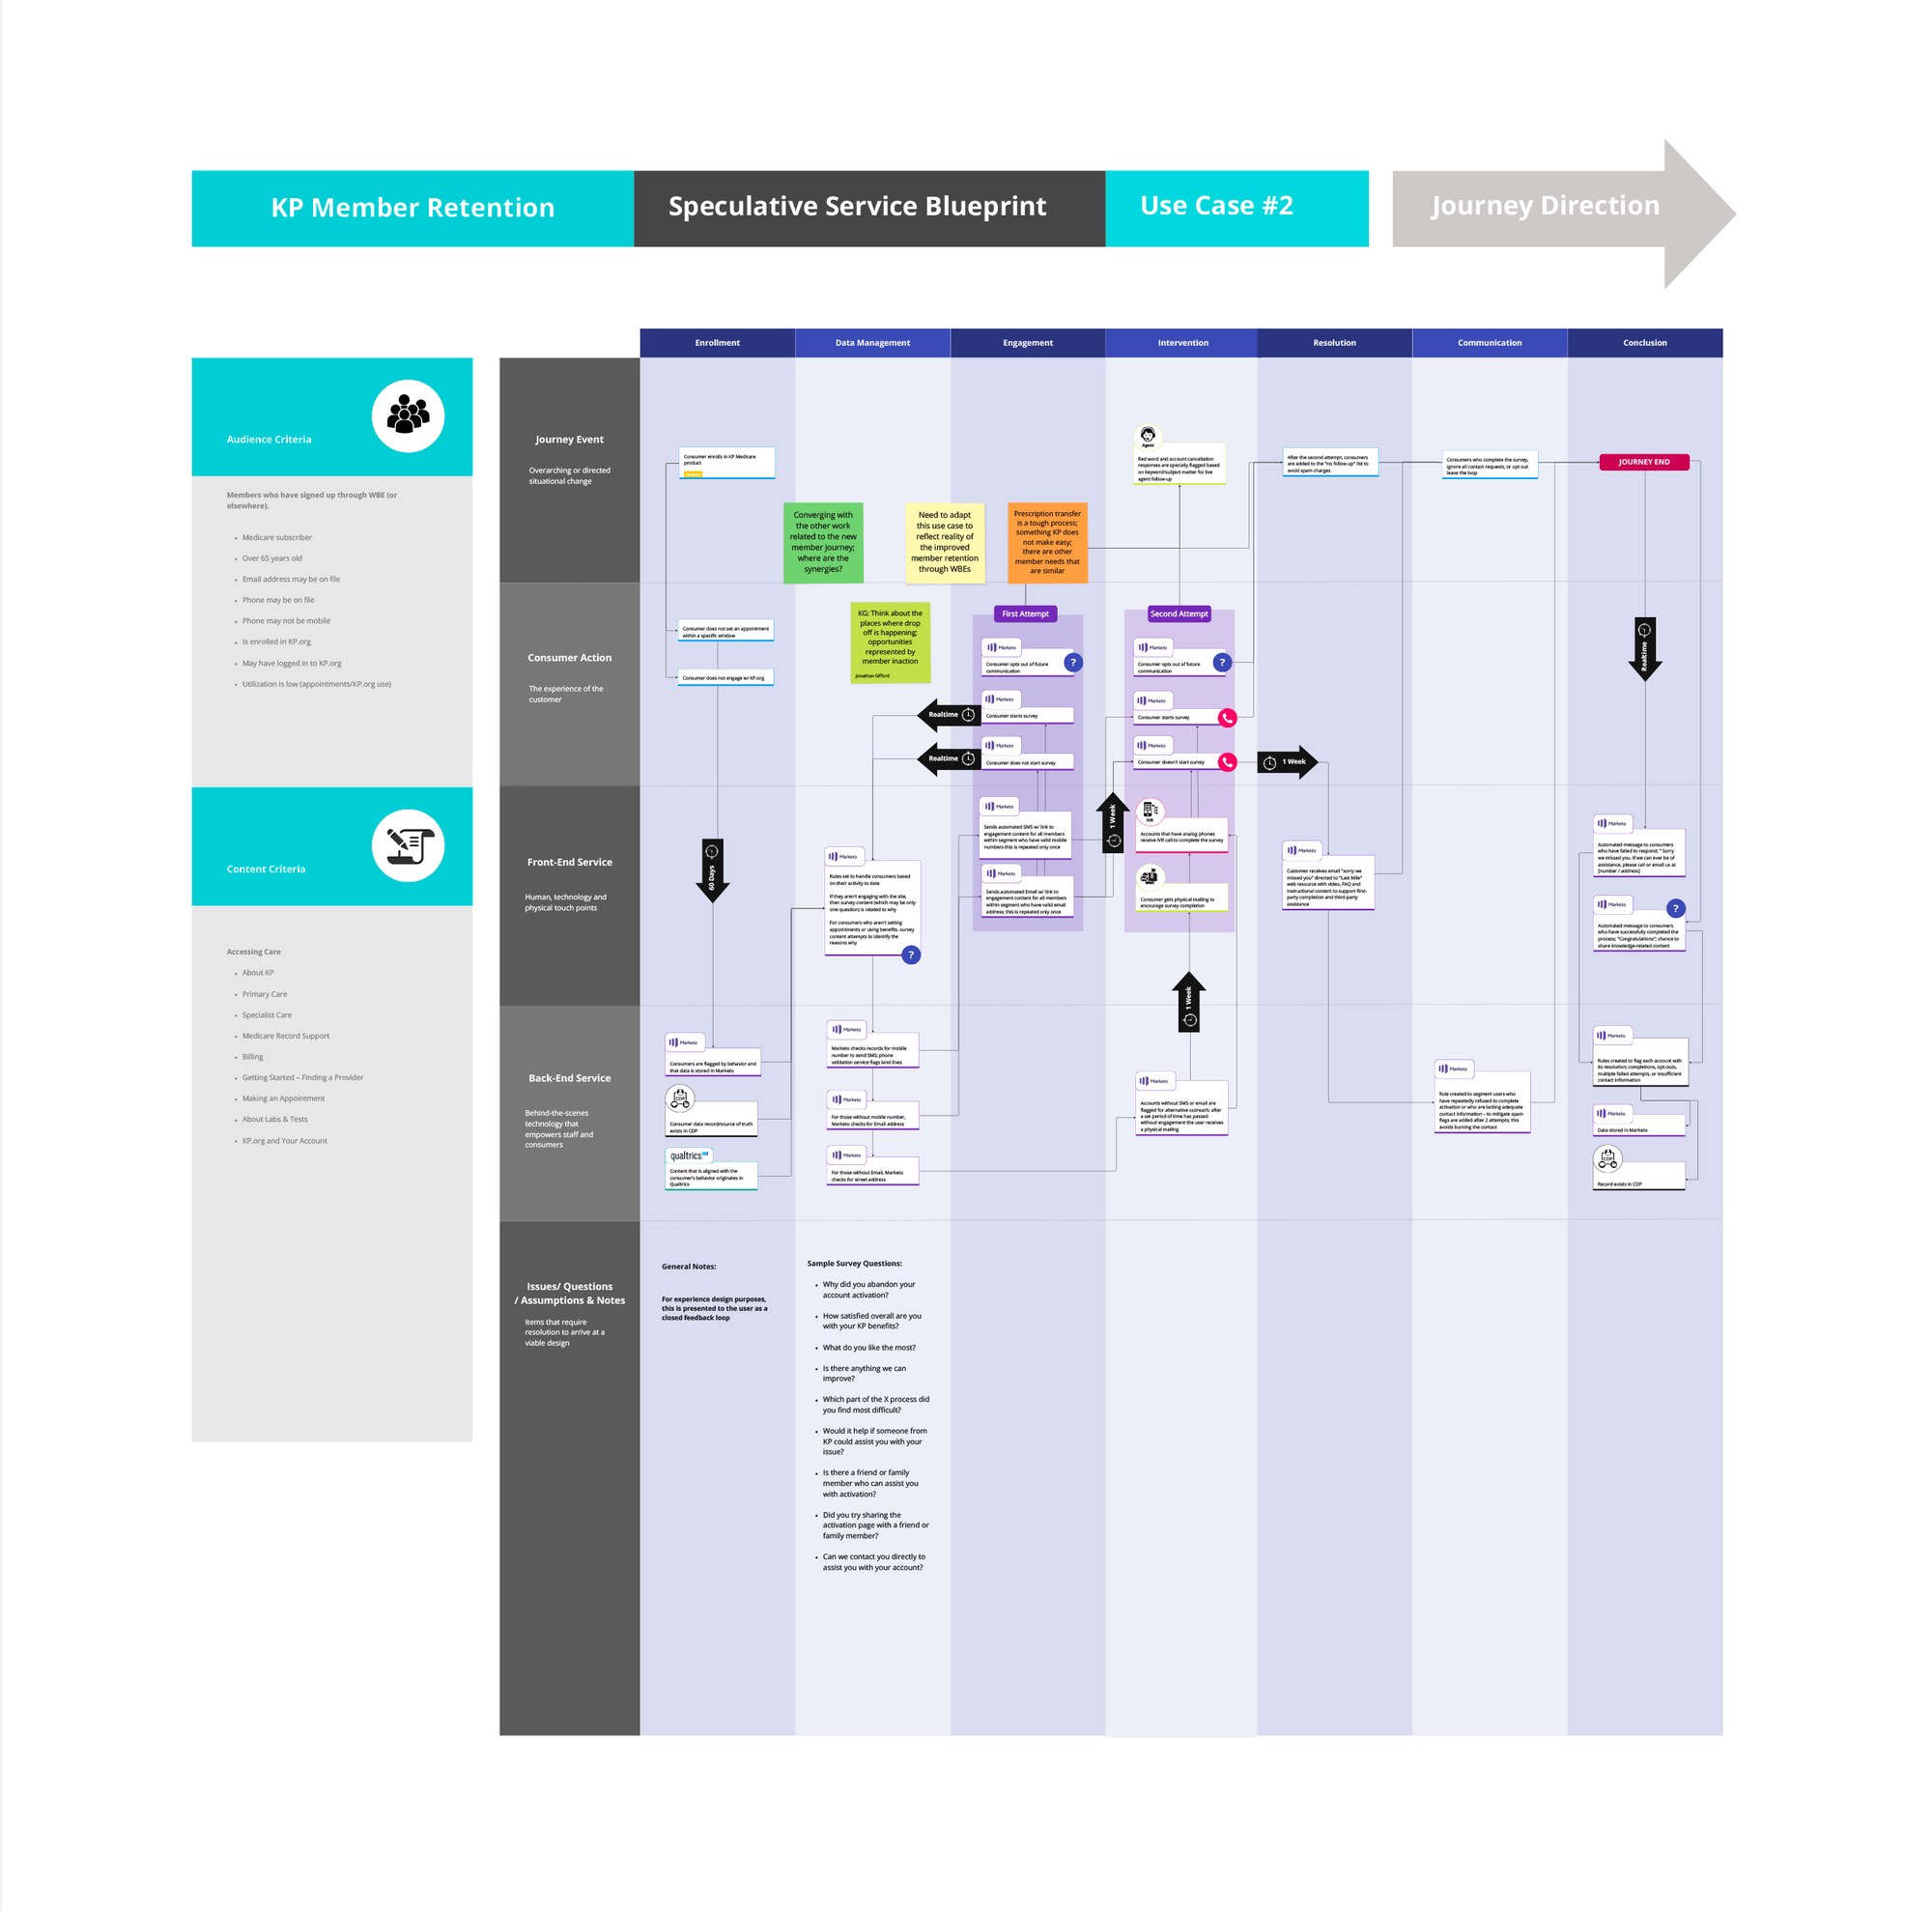
The faster we spot and address the needs of members who are struggling or at risk, the better our odds of success.
04
Design
Using that foundation, we produced journey maps, user flows, and wireframes aimed at cutting friction and improving task completion. We simplified navigation, clarified decision points, and streamlined enrollment and account management, standardizing interaction patterns across products so the experience felt predictable.
Design work also focused on clear content, usable forms, and accessibility, to reduce the effort each task took. Shared design systems kept things consistent while still leaving room for individual product needs.
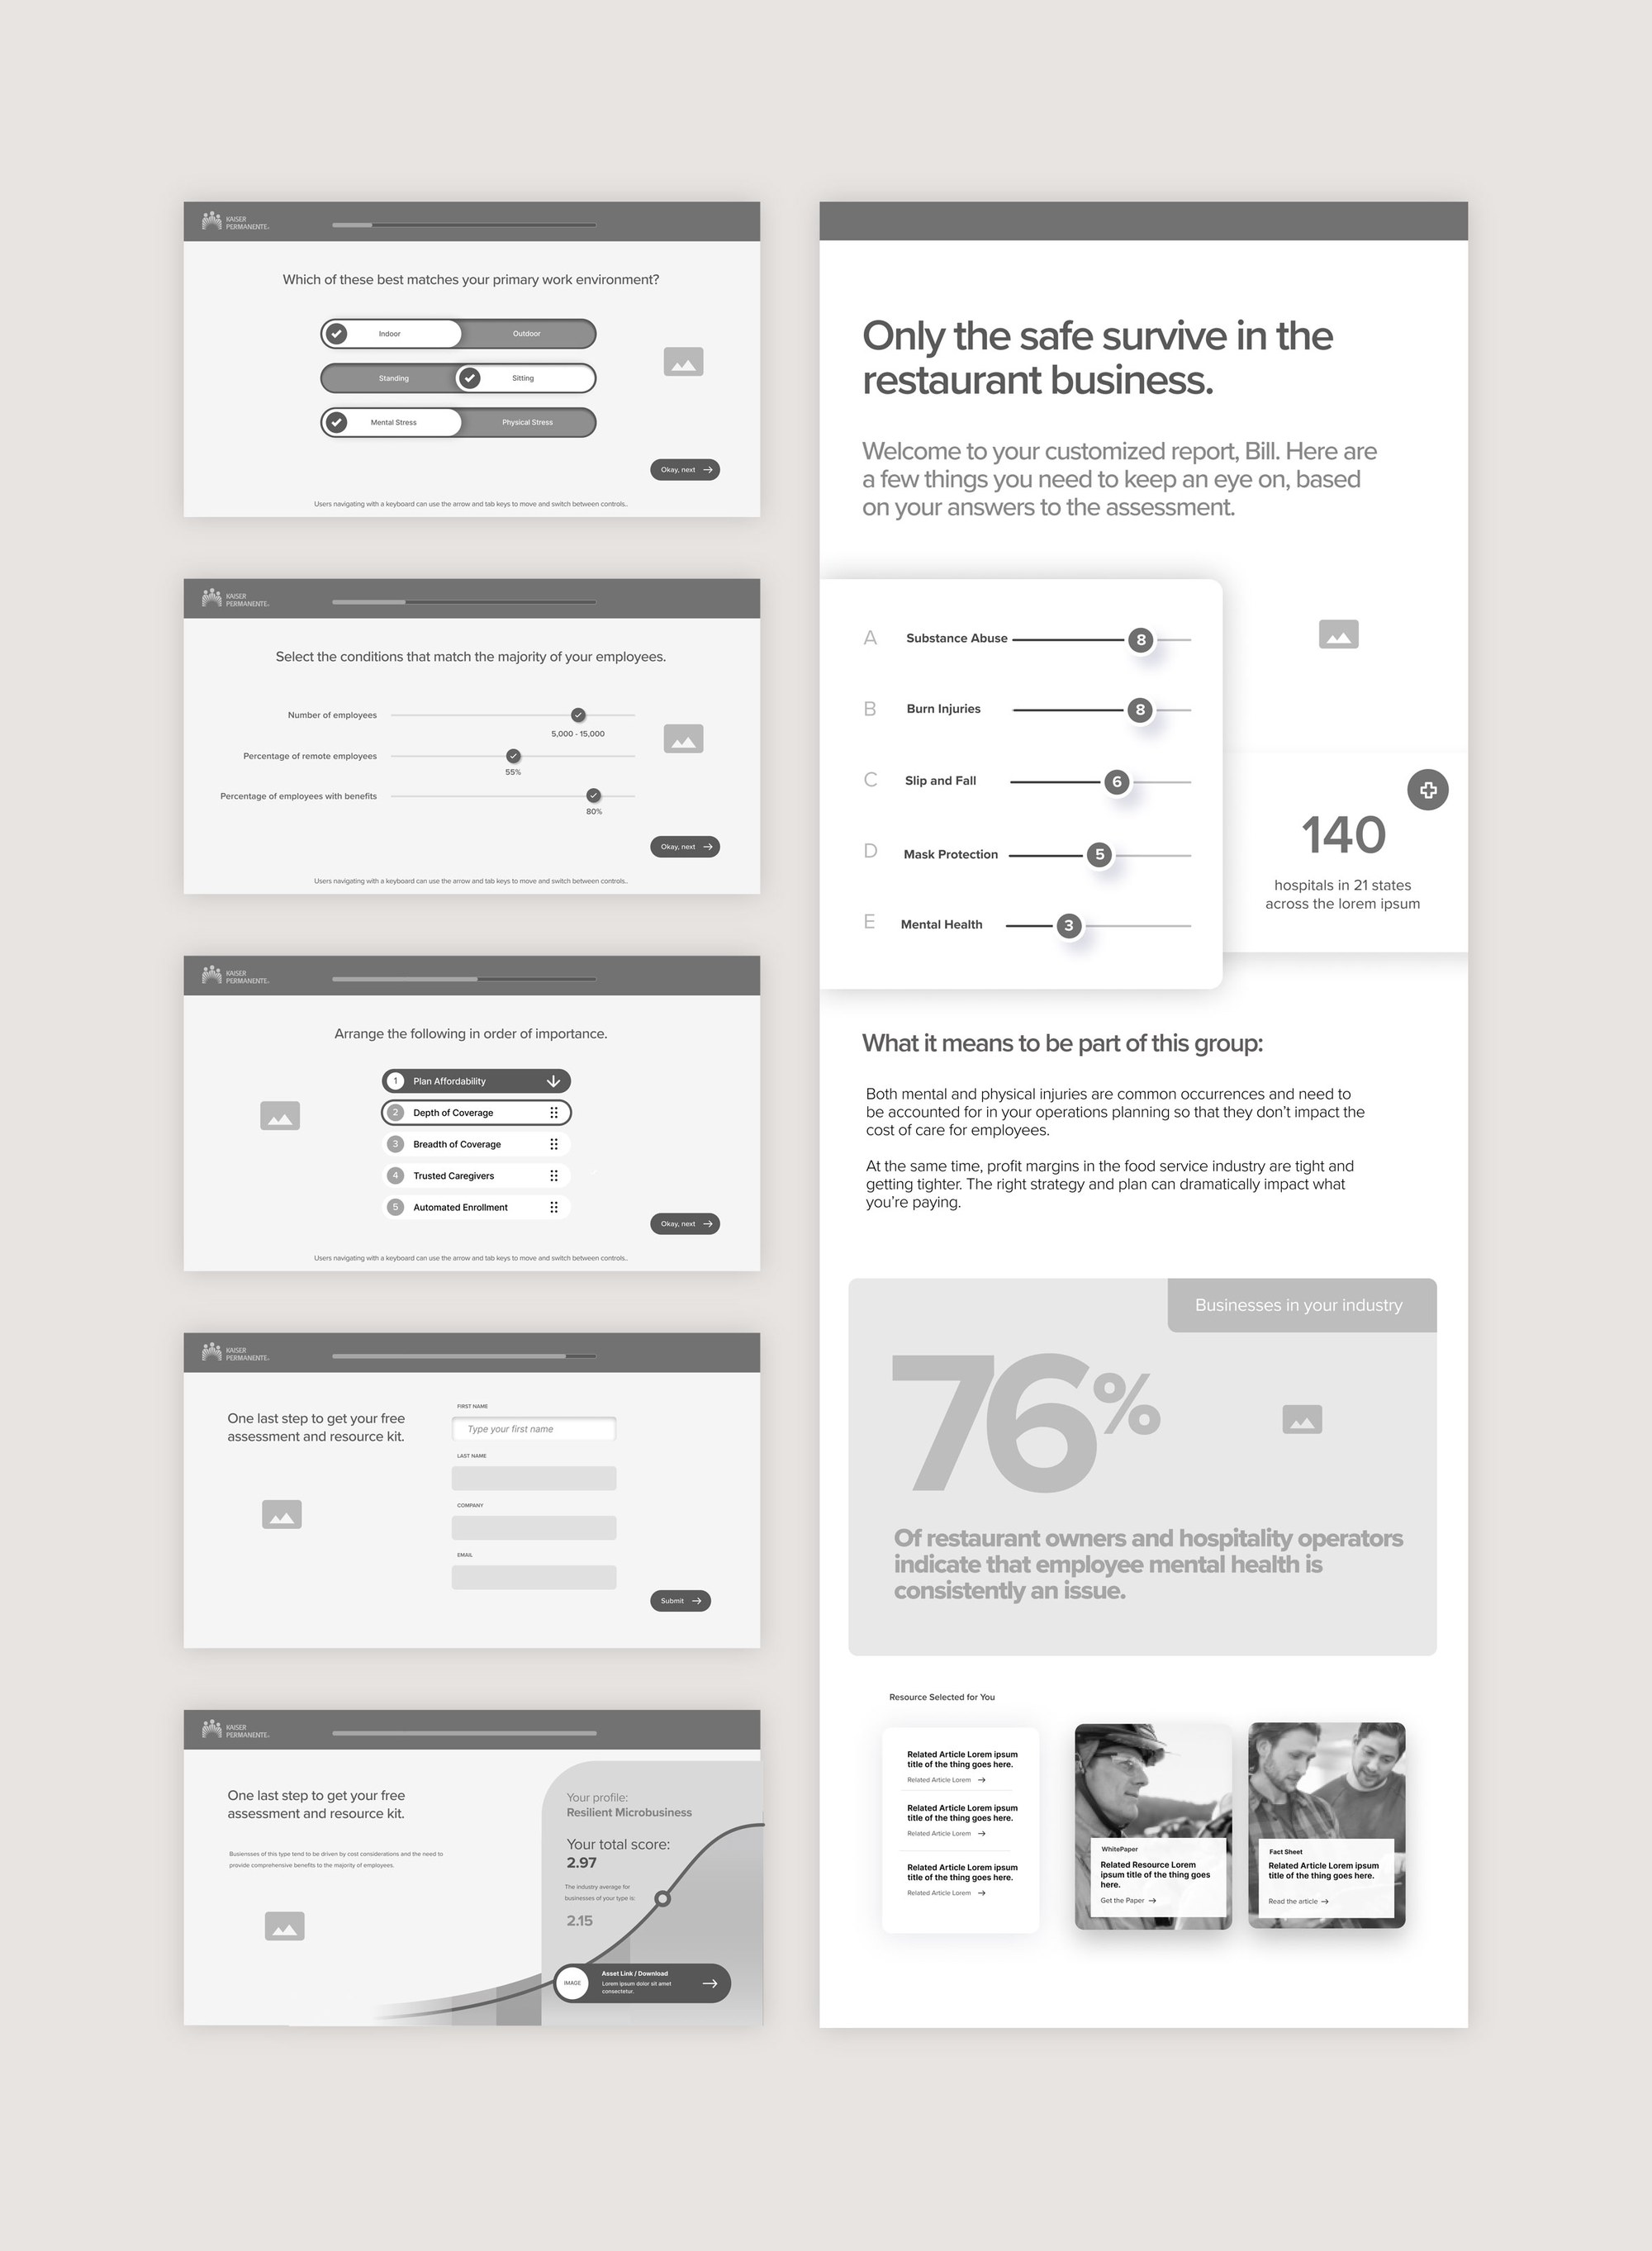
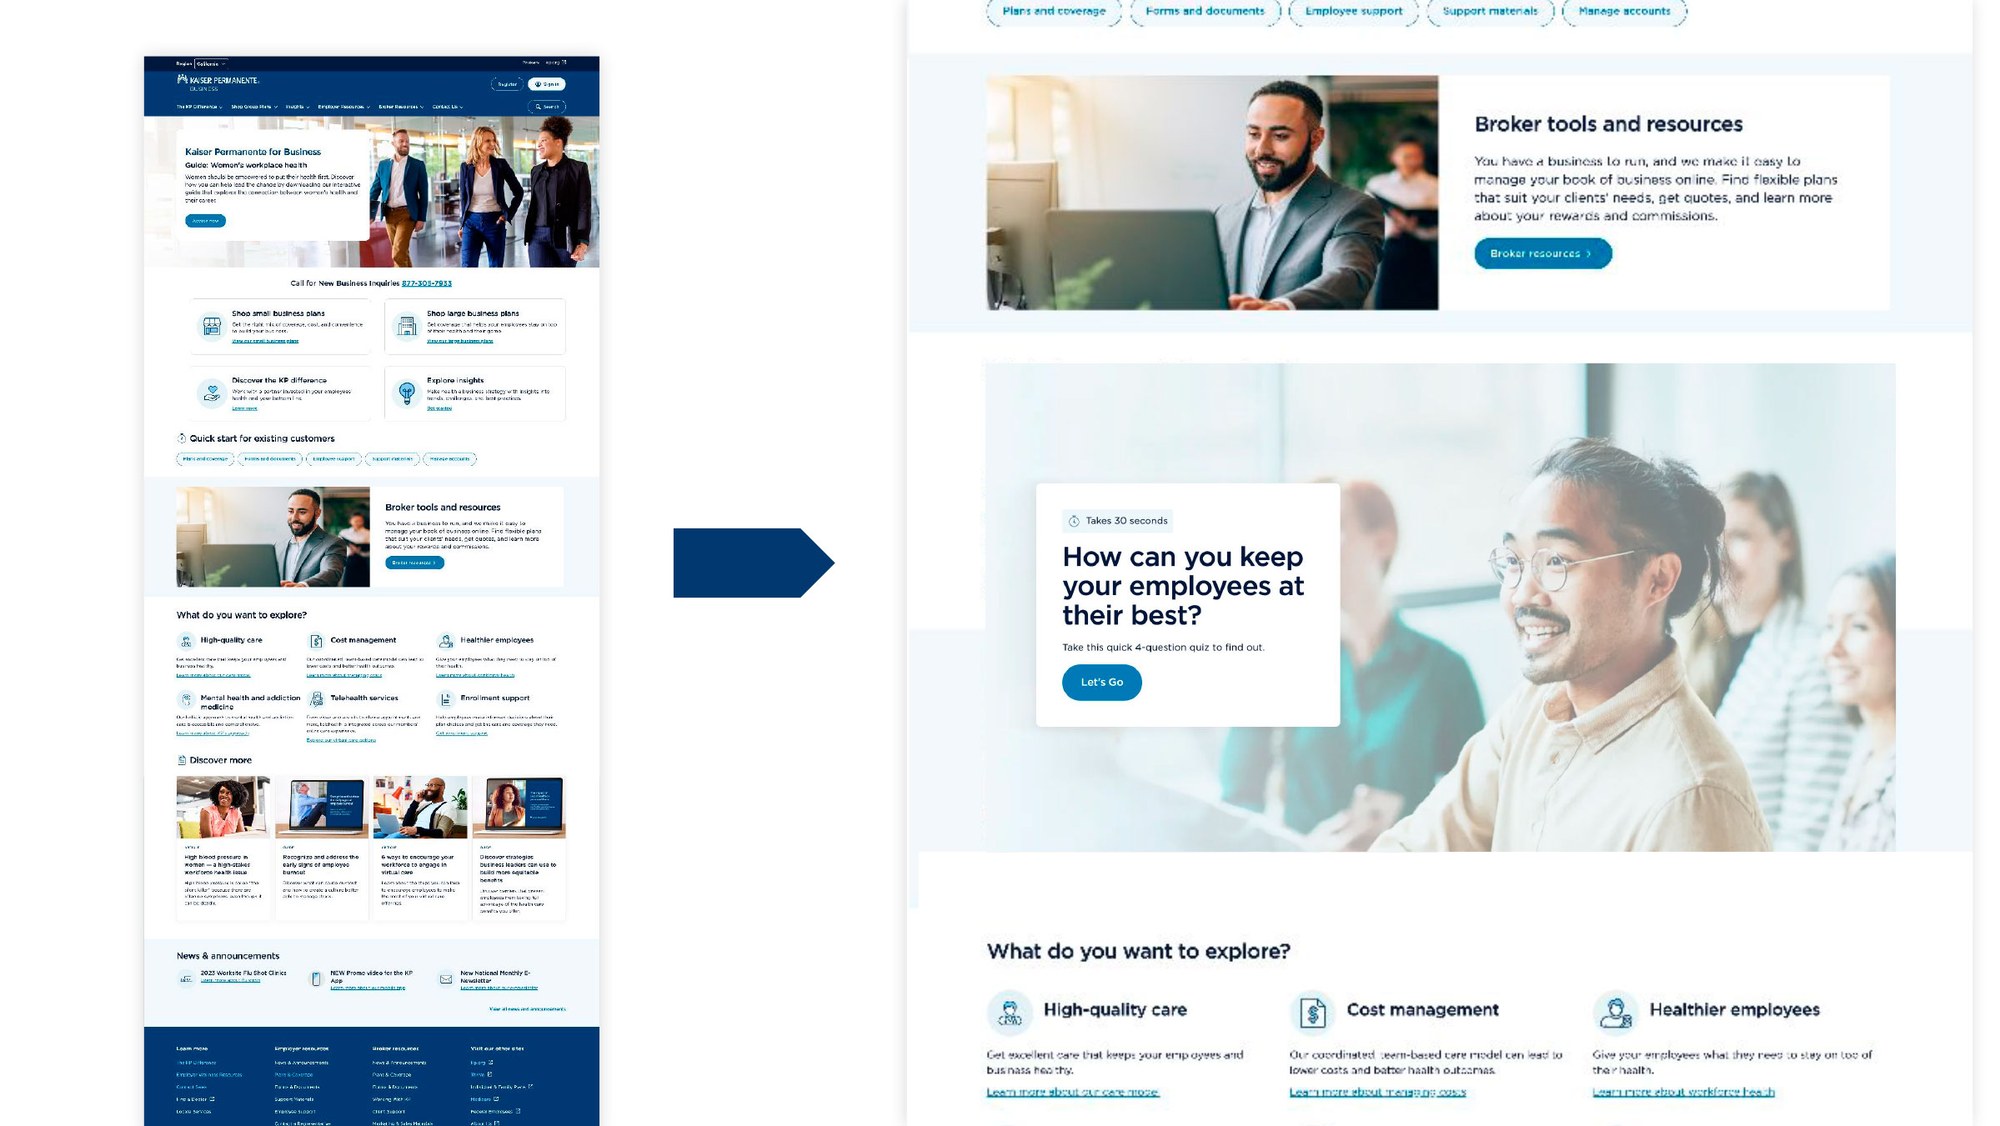
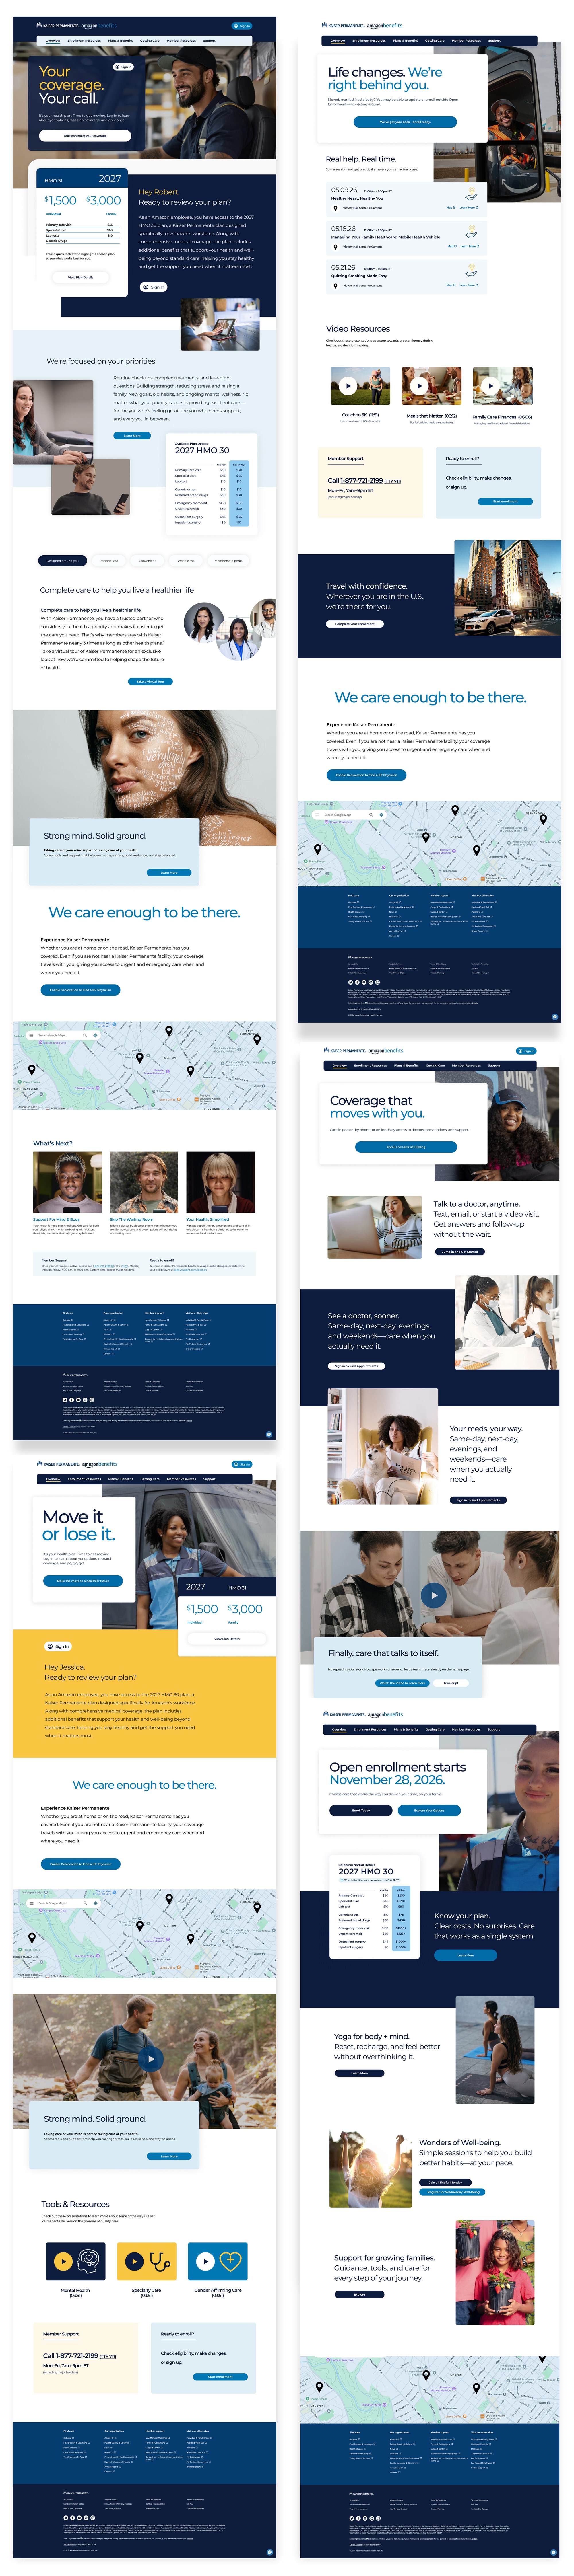
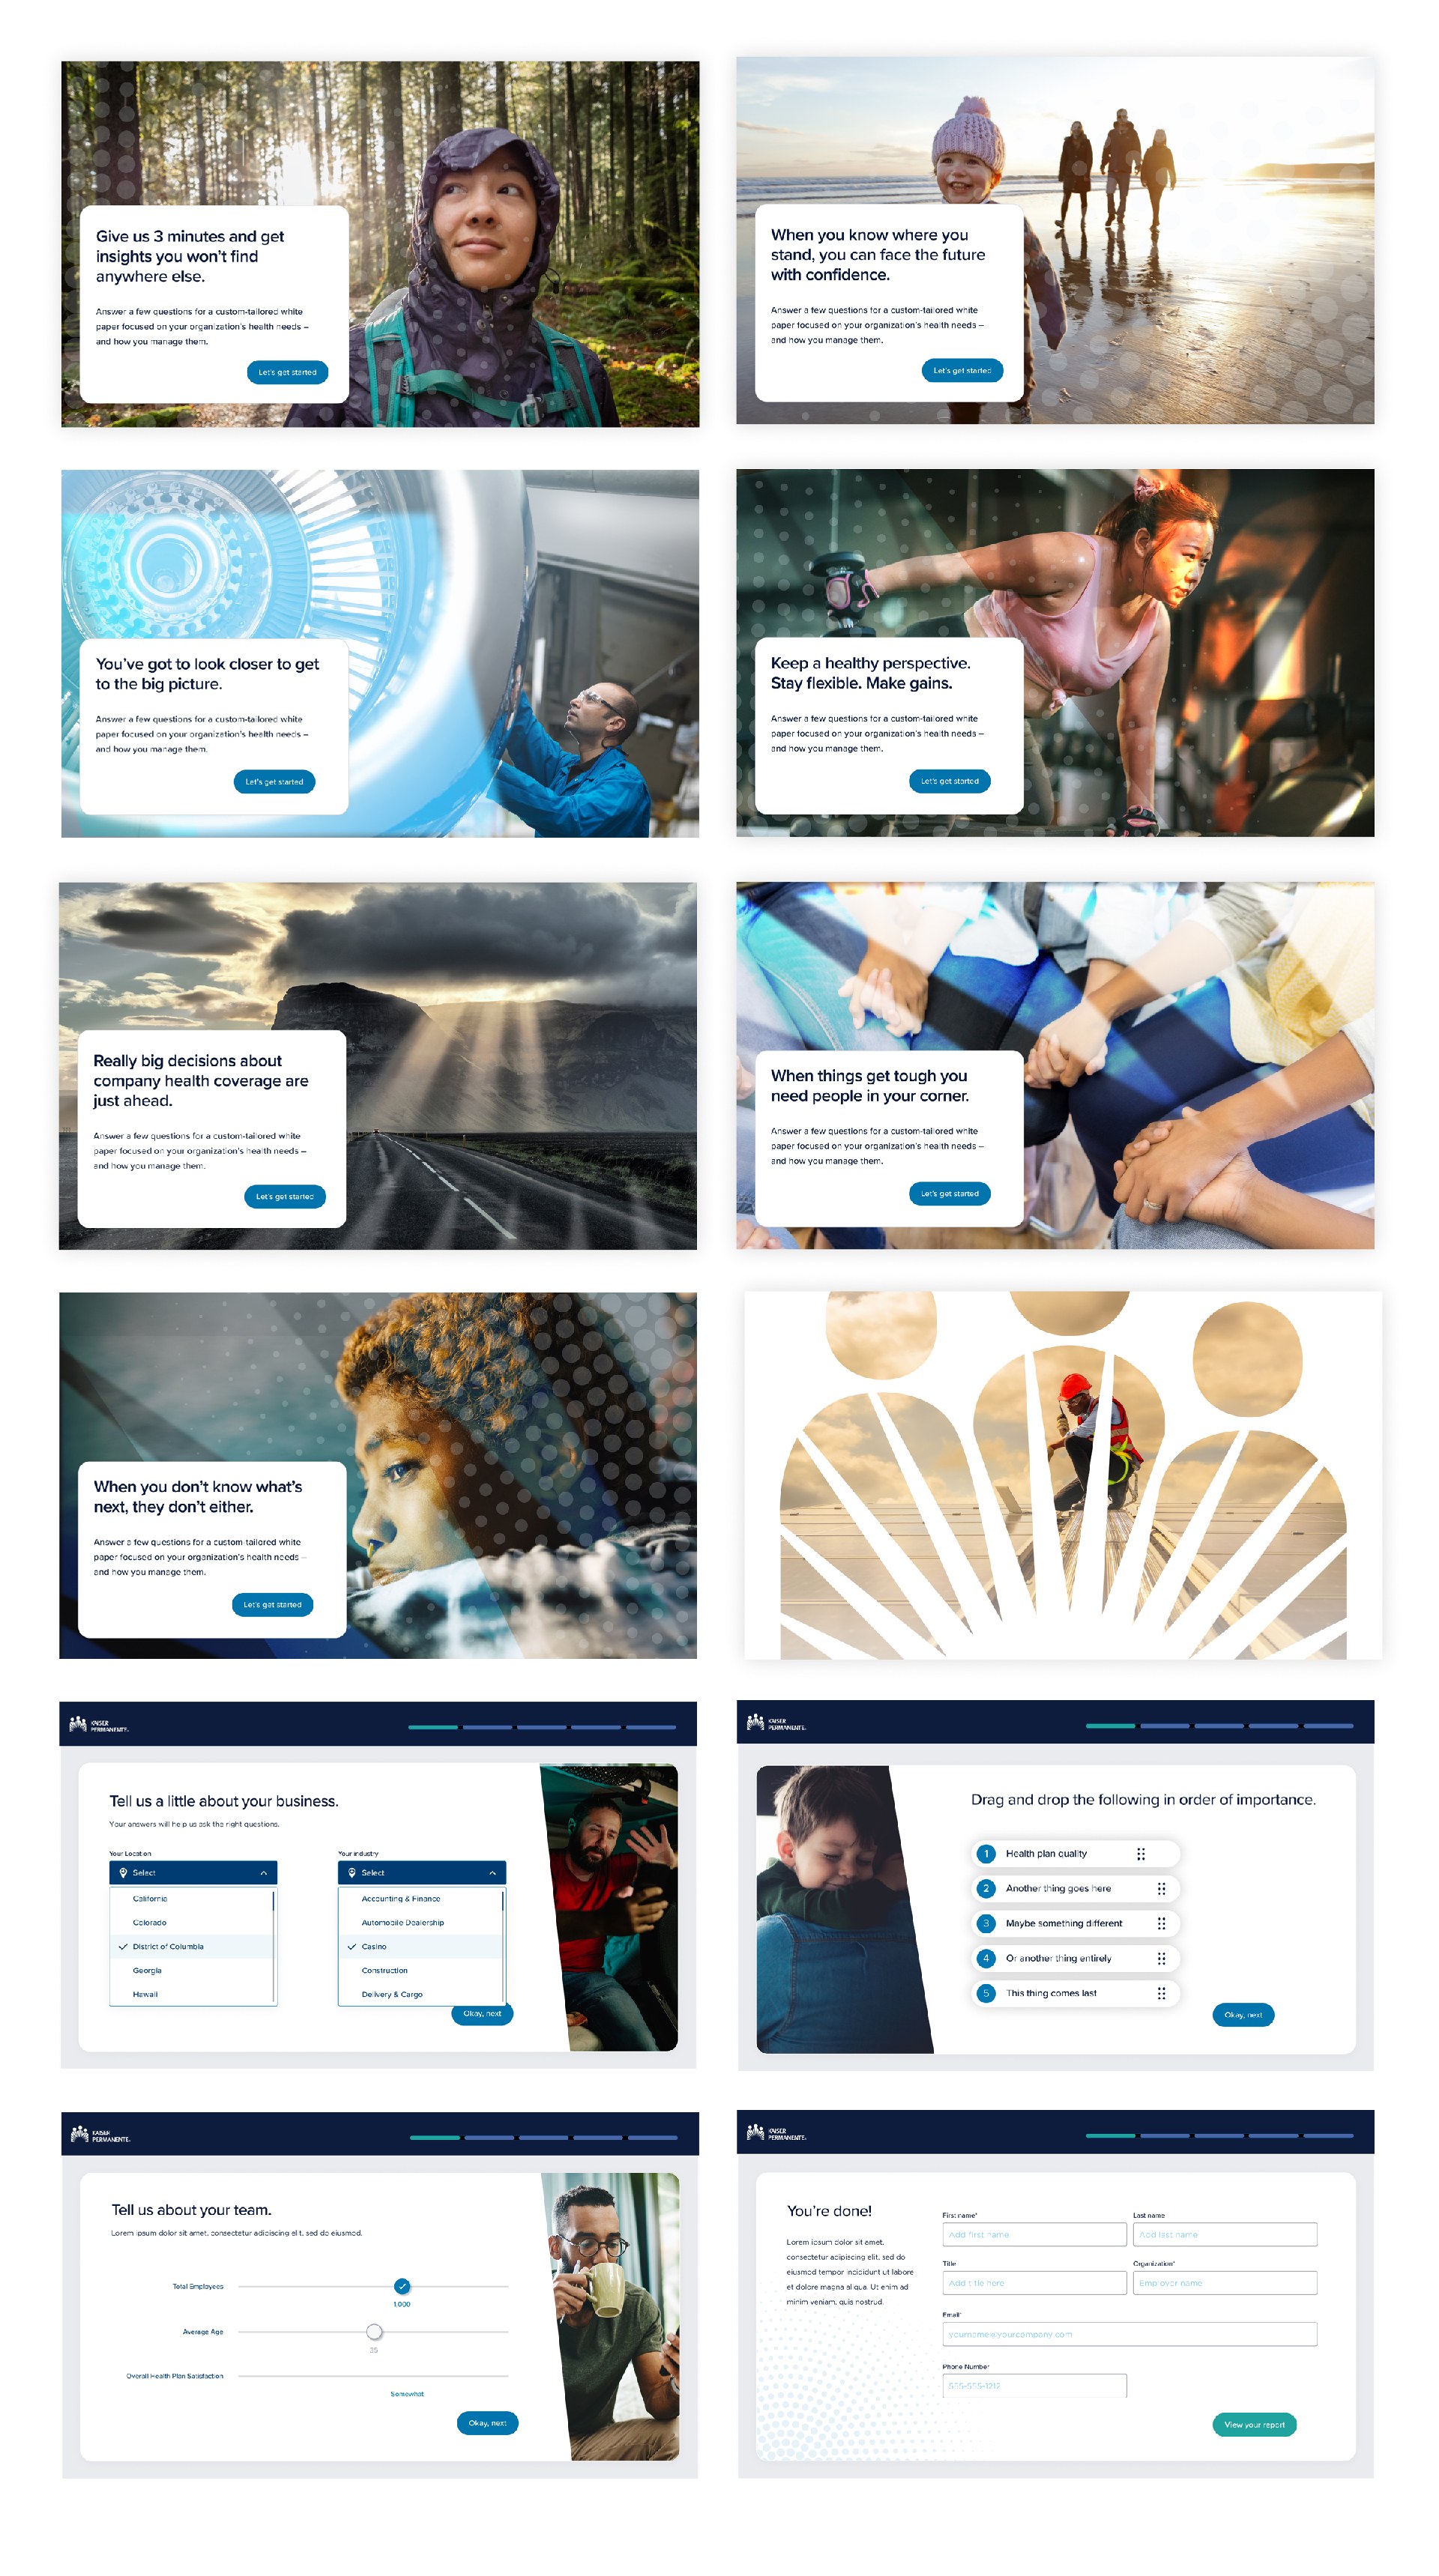
Cross-functional collaboration mattered a lot here. Product, engineering, research, and business teams aligned on priorities using the blueprint and KPI insights to guide decisions and measure impact. I documented design decisions and requirements so implementation stayed aligned across teams.
05
Outcome
The result was a set of targeted improvements that added clarity, cut friction, and supported higher conversion across key member journeys. There were no big visual changes; the gains came from practical fixes that made tasks easier to finish and gave the organization a way to tie design decisions to performance goals.
First-year results showed gains in retention and site performance. Outside business factors may have played a part, but the work held up well enough that the organization started rethinking service blueprints more broadly.